Operations | Monitoring | ITSM | DevOps | Cloud

Monitoring

The latest News and Information on Monitoring for Websites, Applications, APIs, Infrastructure, and other technologies.

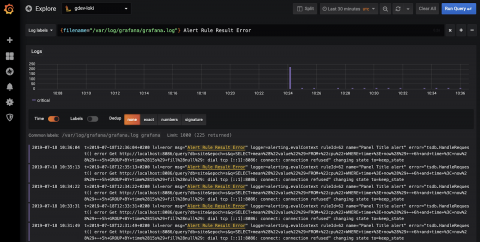
New in Grafana v6.3: Introducing Loki's Log Row Context Viewer

With the release of Grafana v6.3, we are introducing a significant improvement to Loki’s log exploration workflow in Grafana Explore. Launched at KubeCon North America last December, Loki is a Prometheus-inspired service that optimizes storage, search, and aggregation while making logs easy to explore natively in Grafana. Loki is designed to work easily both as microservices and as monoliths, and correlates logs and metrics to save users money.

Watching the Chaos: Monitoring and Chaos Engineering

The online world is full of contrasts. On the one hand, you have site reliability engineers whose job is to keep the business running by ensuring an app’s smooth operations. On the other hand, you have the DevOps staff, whose goal is to minimize cycle time—the time from business idea to feature in production. These two teams can have conflicting objectives.

New Automatic Citrix Discovery and Dependency Map

Goliath's enhanced Topology View, the new Automatic Citrix Discovery and Dependency Map, gives you the only automatic dynamic overview of your entire Citrix infrastructure with true end-to-end visibility of the health of your Citrix infrastructure, configured from a single console.

SQS and Lambda: a Quick Tutorial and How to Handle Failure Modes

Since Lambda added SQS as an event source, there has been a misconception that SQS is now a “push-based” service. This seems true from the perspective of your function because you no longer have to poll SQS yourself. However, SQS itself hasn’t changed – it is still very much a “poll-based” service. The difference is that the Lambda service is managing the pollers (and paying for them!) on your behalf.

Serverless and containers - how and when to use them

If you have anything to do with the world of cloud computing or even programming for that matter, then I’m sure you’ve heard of different terms being tossed around such as “serverless computing” or “containers,” and even “monolithic architectures.” A lot of people who understand such computing methods can have a bad habit of using these terms without leaving any explanation as to what they are.

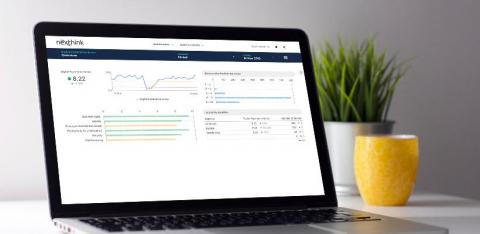
Settling the Score: The Digital Employee Experience Score That Helps IT Power Business

Thousands of IT professionals wake up every morning focused on improving their employees’ digital experience at work. Even while our customers and their forward-thinking tech executives work tirelessly to improve that experience, many expressed frustration with their inability to show progress and success.

Computing Memory Usage According to Task Manager

When you look at Task Manager, it’s hard to compare it to any counter you see in Performance Monitor. The reason is there are many ways to discuss memory usage and it’s cousin free memory. If you think about it, you really don’t want your computer to have free memory laying around. That would represent computer resources the computer could be using but isn’t.

Copy and paste widgets to share data across teams and dashboards

As your environment grows in scale and complexity, finding faster ways to build rich dashboards and share strategic insights with the right team members becomes more important. To help you easily share data with anyone, anywhere, we are happy to announce that you can now copy and paste widgets within Datadog (across dashboards, Notebooks, and accounts)—and even in emails and other communication channels like Slack.