Operations | Monitoring | ITSM | DevOps | Cloud

Monitoring

The latest News and Information on Monitoring for Websites, Applications, APIs, Infrastructure, and other technologies.

Monitoring Usage and Maintaining Effectiveness

In 2018, AWS pulled in $25.7 billion. Amazons serverless cloud-computing platform keeps growing every year, and with that growth comes the same types of problems every massive effort faces: the limits and deterioration of performance as time goes on. With the rise of serverless technology, developing application and new services has never been easier.

[OpsComm June] Driving Real Business Value with the OpsRamp Cost Savings Calculator

June 2019 saw the launch of The OpsRamp Cost Savings Calculator, a simple and powerful tool which helps IT experts quantify how much they can save with OpsRamp's service-centric AIOps platform. Our field marketing team had a blitz with two major events - HPE Discover and CloudExpo Santa Clara where we showcased our AIOps and hybrid IT monitoring capabilities. June also saw our resident experts making several contributions across different media outlets and events.

Bringing AIOps to Hybrid Cloud Monitoring and Management

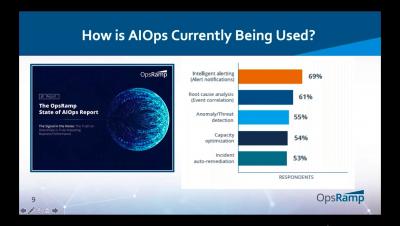
Artificial intelligence for IT Operations is purpose-built to ingest large sources of data from infrastructure and point tools, and produce actionable insights on root-cause analysis and incident remediation. How do you bring these innovations to an enterprise ecosystem that’s also in the middle of cloud migration and overall digital transformation?

The Three Pillars of Kubernetes Observability

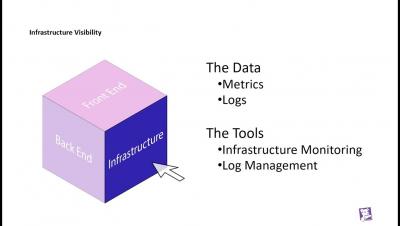
The three pillars of observability are metrics, logs, and traces. To get a complete view into your applications as well as the Kubernetes platform they run on, you need to be looking at all the different perspectives. In this session, we will look at each pillar to see how we can use the information collected to understand what is happening in our environment today and how to troubleshoot the problems we experience tomorrow. We will share how to do this using various open source tools as well as using the Datadog platform.

Automate workflows with Datadog's Amazon EventBridge integration

Amazon EventBridge is a serverless event bus that routes real-time data streams from your applications and services to targets like AWS Lambda. EventBridge facilitates event-driven application development by simplifying the process of ingesting and delivering events across your application architecture, and by providing built-in security and error handling. We are excited to announce that you can now use our new integration to route Datadog alerts to EventBridge with minimal configuration or setup.

Cross-tenant monitoring with Azure Lighthouse and Datadog

Azure Lighthouse is a new feature that provides improved access management for users and applications across different Azure tenants. With Azure Lighthouse, managed service providers (MSPs) can manage their customers’ environments more easily and efficiently than ever before. Datadog is proud to announce support for Azure Lighthouse, which ensures that MSPs can implement a streamlined, scalable approach to monitoring their customers’ Azure environments.

A Guide to Open Source Monitoring Tools

Open source is one of the key drivers of DevOps. The need for flexibility, speed, and cost-efficiency, is pushing organizations to embrace an open source-first approach when designing and implementing the DevOps lifecycle. Monitoring — the process of gathering telemetry data on the operation of an IT environment to gauge performance and troubleshoot issues — is a perfect example of how open source acts as both a driver and enabler of DevOps methodologies.

What do these error codes mean?

The other day whilst using a very popular website I came across a series of 404 unavailable page messages. I didn’t think much about it at the time but on reflection it made me wonder how many people actually understand what different error codes mean? Hands up, I only know a few and I work in the website monitoring sector. To most, it just means a weird IT message when things go wrong.

Prometheus v2.11 Released

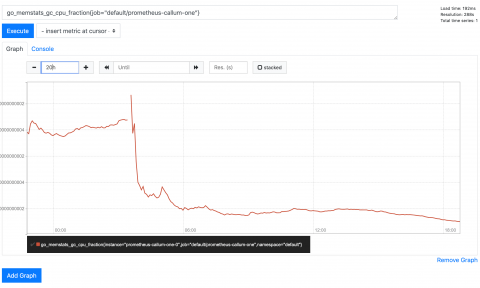
Since graduating within CNCF last August, Prometheus has adopted a new schedule for releases every six weeks. The latest release, v2.11, arrived on July 9. Prometheus 2.11 includes a new option to compress WAL records using Snappy, query performance improvements, the option to use Alertmanager API v2, and more. You can download the latest version here. prometheus_tsdb_wal_reader_corruption_errors is now renamed to prometheus_tsdb_wal_reader_corruption_errors_total.

An Introduction to Python List Comprehensions

Python list comprehensions offer a concise method of interacting with each element of a list. Even though they’ve been available since Python 2.0, their syntax often demotivates people from using them. This article aims to introduce List Comprehensions in a friendly way and offer you one more Python feature to add to your scripting toolbox.