Operations | Monitoring | ITSM | DevOps | Cloud
Monitoring
The latest News and Information on Monitoring for Websites, Applications, APIs, Infrastructure, and other technologies.
Ask Us Anything: The Most Popular Grafana Community Questions Answered!
The Grafana Labs community has more than 600 developers around the world who contribute to our open source projects. From time to time, they also ask really great questions about how to get started in Grafana, how to solve an issue, or how to implement best practices for various functions. Here are three of the most popular questions on the Grafana community board right now – and the answers from Grafana team members and fellow developers.
Sentry for Data: Optimizing Airflow with Sentry
In our Sentry for Data series, we explain precisely why Sentry is the perfect tool for your data team. The present post focuses on how we optimized Airflow for deeper insights into what goes wrong when our data pipelines break. Data enables Sentry’s go-to-market teams by generating high-quality leads and tailored marketing campaigns. Of course, data is also used to steer the business by influencing how we think about Sentry pricing, future opportunities, and feature roadmap.
VDI Stack Monitoring with Goliath Performance Monitor
Quite often I run projects at existing VMware customers that are building a new Digital Workspace. And quite often, that Digital Workspace contains a VDI. Especially when a customer is already using VMware technology in their data center, vRealize Operations (vROps) is used to monitor the environment. Although vROps is a great solution, it’s not really sufficient to monitor the desktop side of things.
Continuous Delivery with Jenkins and Rollbar
Continuous delivery (CD) helps reduce the cost, time and risk of delivering changes by allowing for fast incremental updates to applications in production. However, it’s essential to monitor your application after each deployment. You need to be notified immediately if something is wrong or users are having a poor experience. Rollbar is a leading solution for error monitoring in the software development lifecycle. It alerts you when new errors occur after a deployment.
Why does CUBIC take us back to TCP congestion control?
TCP congestion control is a fundamental part of this protocol and over the years has undergone a process of constant improvement through the generation of different versions, such as TCP Tahoe, Reno, Vegas, and so on. The case of the TCP CUBIC version, which has been the default congestion control applied by Linux/Unix systems.
10 best Web Application Testing Tools in 2019
These days having a website isn’t enough to keep visitors happy and coming back for more. No, you need a website that is secure, loads quickly, and is free of any bugs. Of course, the only way to ensure this is to test your website on a regular basis. If this is not a task that you want to outsource, there is no need to worry. There are a number of web application testing tools that can help you out.
Building Your Observability Practice with Tools that Co-exist
A lot of product marketing is about telling people to throw away what they have in favor of something entirely new. Sometimes that is the right answer–sometimes what you have has completely outlived its usefulness and you need to put something better in its place–but a lot of the time, what’s realistic is to make incremental improvements. If you’ve been tasked with starting, or growing your observability practice, it may seem a long journey from here to there.
Grafana Labs Teams Use Jaeger to Improve Query Performance Up to 10x
Grafana Labs works everyday to break traditional data boundaries with metric-visualization tools accessible across entire organizations. It began as a pure open-source project and has since expanded into supported subscription services. The Grafana open-source project is a platform for monitoring and analyzing time series data. There are also subscription offerings such as the supported Grafana Enterprise version. Grafana Labs’ engineers service more than 150,000 active installations.
Reduce Alert Volume and Gain Timely Event Insights with First-Response Policies
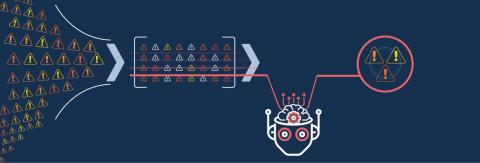
Auto-alert suppression management in OpsRamp delivers first-response actions to reduce redundant and noisy alerts. Learning-based first-response policies ensure that IT teams no longer have to create static rules for a target set of resources by configuring alarm thresholds, defining filter criteria, and specifying time intervals.


