Operations | Monitoring | ITSM | DevOps | Cloud
Monitoring
The latest News and Information on Monitoring for Websites, Applications, APIs, Infrastructure, and other technologies.
Making the 24/7 Customer Experience Possible Through Monitoring
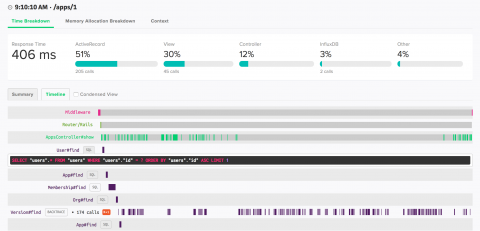
Meet Scout's new transaction timeline view
Today we're happy to announce that our transaction timeline view has exited BETA and is now generally available for Ruby.
Take Troubleshooting Up a Notch and Add Context to Your Logs
Reflections on Monitorama 2019
This year was my third in a row attending (and now speaking at!) Monitorama. Because the organizers do a great job of turning introverts into extroverts for three days straight, it’s always a fun and exhausting time—but one of my favorite parts is how much folks continue talking about and sharing the content, days or weeks after it’s over. So, to continue the drumbeat, here were some of my highlights from this year.
From the First Mile of Infrastructure Performance to the Last Mile of Customer Experience: OpsRamp Synthetic Monitoring Sees What Your Customer Does
OpsRamp delivers real-time observability that IT teams need to understand the performance and availability of business services. Given that modern digital services rely on dynamic and distributed infrastructure, it is critical to pinpoint performance issues that prevent an enterprise from delivering compelling user experiences. So how do you track the end-customer experience as well?
Answer These 3 Questions to Help Find Your MSP Niche
Monitoring Kubernetes, part 4: the Sensu-native approach
At this point in our series, you’re likely quite familiar with the many opportunities and challenges that Kubernetes presents (especially when it comes to monitoring!). The last couple of posts take at a look at Prometheus for monitoring Kubernetes, with a side-by-side comparison with Sensu, and illustrate how they work in tandem.
11 web monitoring mistakes startups need to avoid
As an Internet startup, you have to put out innovative, meaningful solutions for your users. Therefore, no matter what that solution may be, you’ve got to make sure that the solution is available, functioning, and has excellent performance at launch and afterwards. To help you succeed and to avoid common web monitoring mistakes, we’ve put together a list for you.


