Operations | Monitoring | ITSM | DevOps | Cloud

Monitoring

The latest News and Information on Monitoring for Websites, Applications, APIs, Infrastructure, and other technologies.

A Look Inside GitLab's Public Dashboards

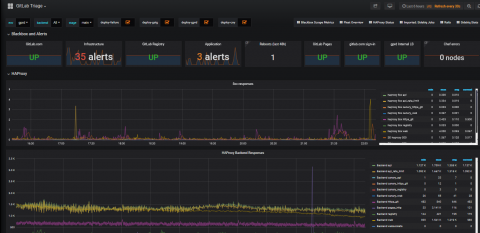
There are transparent companies – and then there’s GitLab. “GitLab is a ridiculously transparent company,” said Ben Kochie, a Staff Backend Engineer for Monitoring at GitLab. “When GitLab has a database outage, we live stream the recovery on YouTube.” GitLab has the same bare all approach to its metrics. “All of our Prometheus metrics are available on a public Grafana dashboard,” Kochie told the crowd gathered at GrafanaCon.

Cloudflare Outage Wreaks Havoc on Major Sites Around the World

Cloudflare, a company that provides CDN services to major websites around the world, recently experienced an outage that took down many of their customers’ sites. The outage began around 7AM EST, and many major companies, including web hosting company WP Engine and chat service Discord also experienced outages due to issues over at Cloudflare. Cloudflare has identified the source of the problem and implemented a temporary fix until the issues can be resolved permanently.

Tackling API Gateway Lambda performance issues

API Gateway is a powerful tool for creating a coherent API out of a set of multiple disconnected remote function providers, and API Gateway with AWS Lambda, when used properly, can give you the capacity to create truly powerful serverless APIs. However, given that API Gateway is a layer between your requests and the code itself, there are latency concerns that API Gateway Lambdas may face that may not be present when working with other architectures.

Cloud-based vs On-premises Monitoring: Similarities, Differences, and Best Practices

Reliability and user experience are no longer just “nice to have” features. Many companies provide similar services and competition is just a click away. Those with state-of-the-art offerings will be ahead of the pack and have more resources for ongoing improvements. Certainly, speed and uptime are not for free, but the good news is that even with a small budget, reliable applications can be realized.

I manage my SaaS with Trello and Reminders

Ok, not completely true. I also use Stripe, Github, AWS, Heroku, Ghost, AppOptics, Intercom and Mailchimp. And some bookkeeping and tax tools. Don't forget the code editors! But! When I plan my day, I spend most of my time in Trello and Apple's stock Reminders app. I also use Numbers once a week or so. This post is turning out to be click bait. Read on, it's really not. In former jobs I went through probably every project management and productivity tool out there.

How I set up SSL with Let's Encrypt for my SaaS customers' dashboards

Recently I pushed a long overdue feature for Checkly: SSL for customers' public dashboards. This was kinda, sort of, totally missing when I launched and many customers asked for it. Setting up free SSL turned out to be fairly smooth because of Most principles explained here are totally transferable to whatever stack you are using. There are some pretty important gotcha's though, so let's dive in. Customers of Checkly can create public dashboards and host them on a custom domain.

AWS Lambda with Python: A Complete Getting Started Guide

In this post, we’ll learn what Amazon Web Services (AWS) Lambda is, and why it might be a good idea to use for your next project. For a more in-depth introduction to serverless and Lambda, read AWS Lambda: Your Quick Start Guide to Going Serverless. In order to show how useful Lambda can be, we’ll walk through creating a simple Lambda function using the Python programming language. We’ll test it out, as well as take a look at what Lambda provides for metrics and logging.

Explore your data in full-screen graph mode

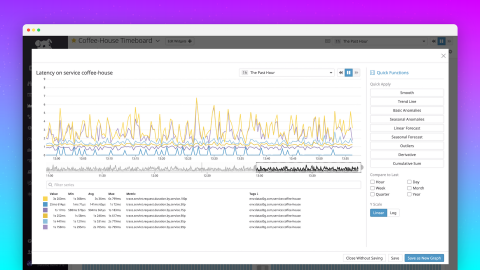
As you navigate through Datadog, you may find that you want to dive into a graph to explore your timeseries data more deeply, or make quick changes to a graph without permanently altering it. To make it easier to explore the data in your graphs, we’re excited to introduce a newly revamped full-screen view for our timeseries graphs. You can now quickly and easily apply functions, navigate through time to find anomalies, and save and share your work.

Real-Time Analysis Provides Valuable Insights for IT Pros

After stepping out for lunch, you return to find that Uptime.com has issued a downtime alert to your work email address. You’ve been away from your computer for about 45 minutes, blissfully unaware of your inbox and enjoying a moment of zen. Now that you’ve walked head-first into a small crisis, what’s the fastest way to confirm downtime, get server response codes, and perform outage analysis? We’ve got you covered with our real-time analysis tool.