Operations | Monitoring | ITSM | DevOps | Cloud

Monitoring

The latest News and Information on Monitoring for Websites, Applications, APIs, Infrastructure, and other technologies.

OpsRamp Presents at Cloud Expo Santa Clara

Come and learn the latest best-practices on artificial intelligence, cloud management, and the rise of the data-driven IT organization. Global public cloud spending worldwide has now topped $200 billion, according to Forrester Research. Organizations are moving to the cloud at a breakneck pace, looking for agility, flexibility, reliability and cost control.

Intro to NGINX

If you've been following along with my posts, you have a sound introduction to Apache Web Server, how it functions, it's place in history, and how Sumo Logic can help you sort through the numerous logs provided. Apache Access and Error logs are integral to understanding the traffic patterns and issues your users face when accessing your web applications. Sumo Logic helps administrators parse through logs, isolate issues, and determine the root causes of errors.

Serverless app to speed up all your Lambda functions

A while back, I wrote about how you can shave latency off every AWS SDK operation by enabling HTTP keep-alive, like this. It had the desired effect and I saw lots of people apply this technique in their projects. But it also resulted in the same 10 lines of code being copied and pasted everywhere! I began thinking about ways to distribute an optimized version of AWS SDK so everyone can benefit.

Investigating Timeouts with Tracing

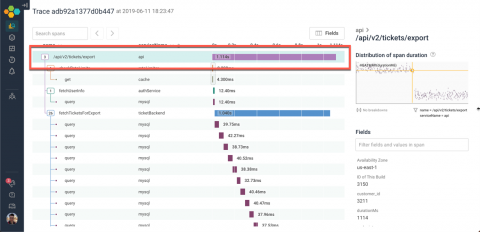
Tracing is one of the key tools that Honeycomb offers to make sense of data. Over the last few weeks, we’ve made a number of improvements to our tracing interface — and, put together, those changes let you think about traces in a whole new way! Tracing makes it easier to understand control flow within a distributed system. We render traces with waterfall diagrams, which capture the execution history of individual requests.

17 Tech Support Tickets You'll Be Happy You Didn't Receive

If tech support had a motto, it’d be reminiscent of Rule #4 of the Auvik Way: Even when it’s not your fault, it’s your problem. But sometimes, there are problems so bad you wouldn’t want to deal with them. We’ve rounded up 17 examples from the r/techsupportgore subreddit that are sure to send a palm to your face and a shiver down your spine: Plugging in your USB receiver with a hammer for that flush mounted look. from r/techsupportgore Good luck getting that one out.

Demonware's journey to assisted remediation

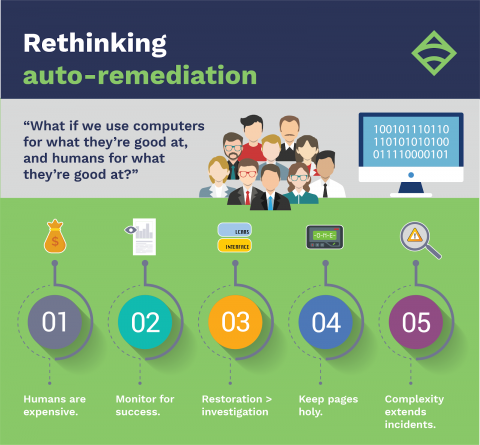
At Monitorama 2018, Engineering Manager Kale Stedman shared Demonware’s journey to assisted remediation, or as he likes to call it: “How my team nearly built an auto-remediation system before we realized we never actually wanted one in the first place.” In this post, I’ll recap Kale’s Monitorama talk, highlighting the key decisions that helped his team reduce daily alerts, fix underlying problems, and establish a more engaged Monitoring Team — including the steps the

Understanding Heroku Error Codes with Scout APM

If you are hosting your application with Heroku, and find yourself faced with an unexplained error in your live system. What would you do next? Perhaps you don’t have a dedicated DevOps team, so where would you start your investigation? With Scout APM of course! We are going to show you how you can use Scout to find out exactly where the problem lies within your application code.

Grafana Tutorial: Simple Synthetic Monitoring for Applications

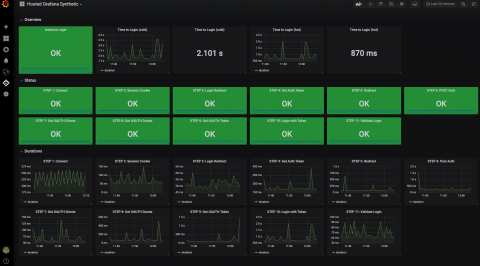
Often there’s a focus on how a service is running from the perspective of the organization. But what does service health monitoring look like from the perspective of a user? There are many metrics that indicate the overall health of a container, vm, or application, but independently they do not indicate if the system is functioning correctly. Often these metrics (CPU, disk, memory) are too narrow, and they can be poor indicators. High CPU may be desirable or bursts of memory usage may be normal.

Paul Dix [InfluxData] | InfluxDB 2.0 and Flux - The Road Ahead | InfluxDays London 2019

Paul will continue to chart the road ahead by outlining the next phase of development for InfluxDB 2.0 and for Flux, InfluxData’s new data scripting and query language. He will discuss Flux’s role in multi-data source environments and explain how InfluxDB can be deployed in on-premise, multi-cloud, and hybrid environments.