Operations | Monitoring | ITSM | DevOps | Cloud
Monitoring
The latest News and Information on Monitoring for Websites, Applications, APIs, Infrastructure, and other technologies.
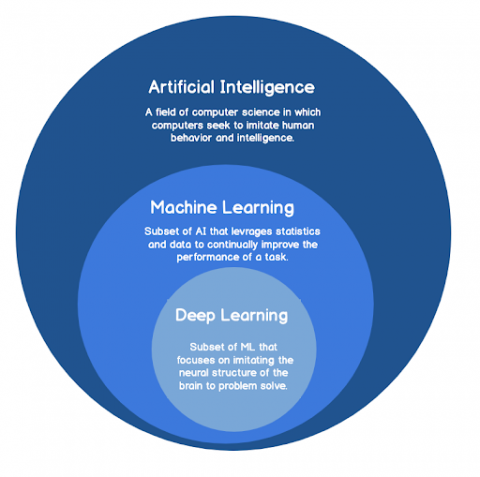
How Machine Learning and Artificial Intelligence Impact Customer Experience
Sonia Gupta [InfluxData] | Introduction to InfluxDB 2.0 & Your First Flux Query | InfluxDays London
Noah Crowley [InfluxData] | Using the Java Client Library | InfluxDays London 2019
Nathaniel Cook [InfluxData] | Extending Flux to Support Other DBs & Data Stores | InfluxDays
ServiceNow Connector Discovery Webinar Replay from Cookdown
How to Install Prometheus on Kubernetes
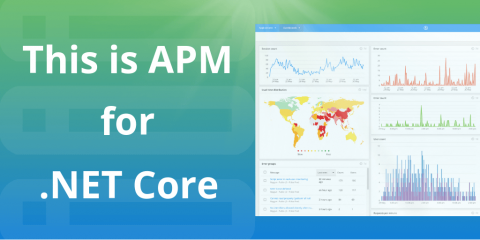
.NET Core support is here for Raygun APM
Lessons learned from running Kafka at Datadog
At Datadog, we operate 40+ Kafka and ZooKeeper clusters that process trillions of datapoints across multiple infrastructure platforms, data centers, and regions every day. Over the course of operating and scaling these clusters to support increasingly diverse and demanding workloads, we’ve learned a lot about Kafka—and what happens when its default behavior doesn’t align with expectations.
Troubleshoot Faster with Anomaly Visualization
LogicMonitor is proud to announce anomaly visualization as an addition to our growing AIOps capabilities! With this new functionality, users are able to visualize anomalies that occur for a monitored resource and compare that anomaly to key historical signals, such as the past 24hrs, 7 days, or 30 days. Anomaly visualization complements LogicMonitor’s existing forecasting functionality and provides another layer of intelligence to better understand resource health.


