Operations | Monitoring | ITSM | DevOps | Cloud
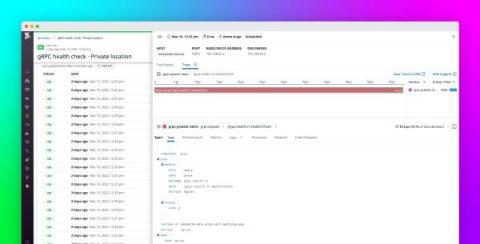
Monitor your gRPC APIs with Datadog Synthetic Monitoring
gRPC is an open source Remote Procedure Call (RPC) framework developed by Google and released in 2016. Although gRPC is still relatively new, large organizations are adopting it in increasing numbers to build APIs to connect complex microservice meshes that use disparate languages and frameworks. gRPC-based APIs can process requests up to seven times faster than REST APIs, and they also allow customers to easily implement SSL authentication, load balancing, and tracing via plug-in libraries.
Synthetics 101 - Part 2: Protecting and growing revenue with proactive monitoring
In part 1 of our synthetics series, we looked at tracking network performance to drive better business outcomes. Here in part 2 of our series, we’ll dig into the very first and most basic business outcome of using digital experience monitoring (DEM). That is, we’ll look at how to protect and grow revenue by proactively monitoring the health, availability and uptime of your critical applications and services, so you can fix issues before your customers’ experience suffers.
Uptime com Transaction Check Basics in less than 3 minutes
Uptime com Transaction Check Best Practices
How cloud-only synthetic monitoring leads to blind spots
Best practices for alerting on Synthetic Monitoring metrics in Grafana Cloud
Ever wonder what your application looks like from the “outside in”? Synthetic monitoring can give you a global overview of your application from your customer’s point of view, observing how systems and applications are performing by simulating the user experience. One tool to help achieve this is the Synthetic Monitoring app, which is a blackbox monitoring solution available in Grafana Cloud. You can use Synthetic Monitoring to monitor your services from all over the world.
What is Synthetic Monitoring?
Find our more about synthetic monitoring: https://www.rapidspike.com/user-journeys/
Synthetic testing: A definition and how it compares to Real User Monitoring
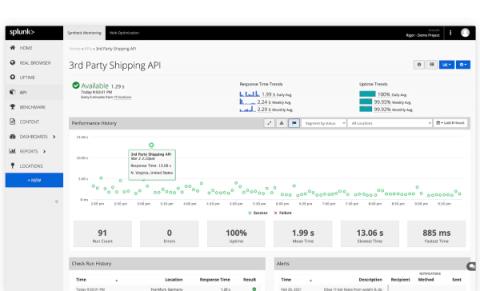
NEW: Splunk Synthetic Monitoring Adds Single Sign-On (SSO) and Security Improvements
Splunk customers are security conscious organizations demanding enterprise-grade features for their global workforce. Today, we are excited to announce several Splunk Synthetic Monitoring updates, including: support for Single Sign-On (SSO) via SAML 2.0, Concealed Global Variables, and an updated synthetic browser version (Chrome 97).


