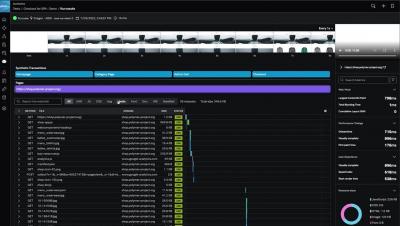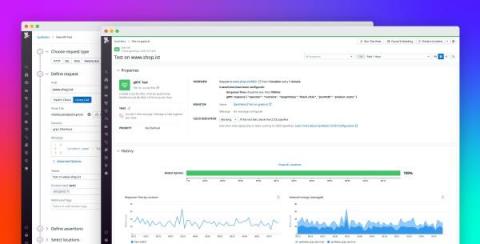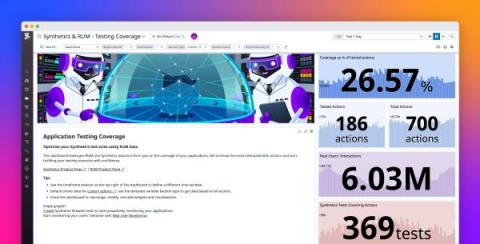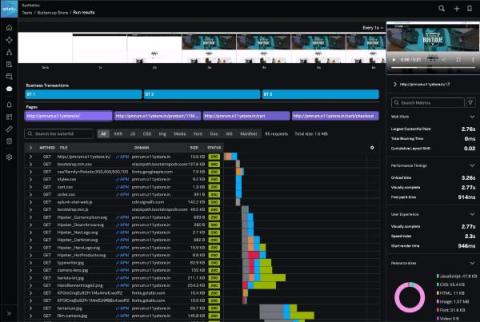
Today we’re proud to announce the general availability of best-in-class Synthetic Monitoring capabilities within Splunk Observability Cloud. Now, IT and engineering teams can proactively measure, monitor and troubleshoot their critical user flows, APIs and services, connected across Splunk Observability.
Website regression testing is a form of software testing that helps to identify and fix problems with website content, functionality, and accessibility. It is a vital part of any testing strategy, as it can help to ensure that the website continues to meet user expectations. Website regression testing typically involves running a series of tests against the website to check for any issues. The tests can be performed by an automated system or manually by testers on the development team.
The Uptime.com monitoring Transaction check just got a few upgrades bringing more granular control to users with complex checks. If you have found yourself struggling with performance in synthetic monitoring, this upgrade is for you. Plus better diagnostic tools to analyze every request we encountered. Available to every Uptime.com user, today we want to introduce these important tools and walk though some use cases that will help you get the most out of them.
Kentik Synthetics is all about proactively testing and monitoring specific elements of your network, the services it relies on, and the applications it delivers. That means using artificial traffic instead of end-user traffic to test a variety of aspects of digital experience monitoring like device availability, DNS activity, web application page load times, and BGP activity. But to test an end-user’s experience interacting with a website, we need to approach things differently.
In my previous blog post, we explored key questions about Synthetic Monitoring, such as what it is, why it’s important, how it works, and how it compares to Real-User monitoring. Synthetic Monitoring is becoming an increasingly-popular method to continuously monitor the uptime of applications and the critical flows within them so that DevOps, IT, and engineering teams are quickly alerted when issues arise. Unfortunately, a good Synthetic Monitoring tool can be expensive.
In a world where the customer’s digital experience is critical to business outcomes, it is crucial to understand how our applications are behaving. As businesses increasingly rely on the performance and availability of revenue-generating applications, the tolerance for downtime and slow response times has plummeted – so the response to production issues must be quick and effective.
In our quest to provide the leading network observability solution, Kentik has been focused on developing a service for NetOps teams that empowers them to have intimate knowledge of their network traffic and the devices that route traffic. Our service helps them plan capacity, project costs, optimize routes, detect unwanted traffic, troubleshoot issues and analyze events.