Adding a Service to AWS
Join an Observability expert and Sumo Logic's Technical Account Manager Ramneet Malhotra as she demonstrates that adding Amazon SQS to the Cloud Formation template and Explore Dashboard panels is pretty painless.


BigPanda supports inbound integrations for alert ingestion out of the box; however, many IT organizations have older, rarer or custom-built tools that require a little more work upfront. Fortunately, BigPanda’s recently announced Open Integration Manager and Email Parser aim to streamline integrating these kinds of monitoring tools with the BigPanda platform.
It’s National Cybersecurity Awareness Month, and as a Cybersecurity Awareness Month Champion Organization, xMatters is proud to be actively participating. Since the National Cybersecurity Alliance started this initiative in 2004, the number of devices connected to the internet and the amount of time we spend interacting online has increased exponentially. The impact on our lives is so massive that it’s become hard to imagine what life would be like without our devices.
Comprehensive observability starts with good instrumentation. OpenTelemetry, aka “OTel,” sets a unified standard, enabling you to instrument your applications once, then send that data to any backend observability tool of choice. OpenTelemetry’s standard for generating and ingesting telemetry data is slated to become as ubiquitous as current container orchestration standards. Because of this, development teams are increasingly adopting OpenTelemetry to their applications.
Customers expect that online services are available all the time. The truth is that outages happen to almost everyone because providing 100% service availability is challenging and costly. Creating reliable and profitable service is, amongst other things, finding the balance between application availability, costs and time to market. Faster feature delivery means less availability as constant changes to production may cause issues and introduce bugs.
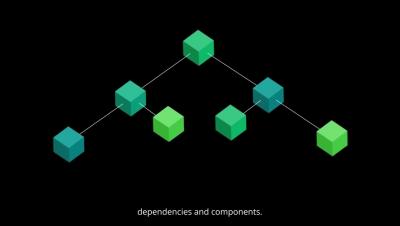
At Grafana Labs we run a lot of distributed databases. These distributed databases all make use of a hash ring in order to evenly distribute workloads across replicas of certain components. For a more detailed description of the architecture of our projects, check out our Mimir architecture docs.