Operations | Monitoring | ITSM | DevOps | Cloud
%term
Feature Spotlight: Transaction Check
Uptime’s transaction checks can continually monitor important functionality of your site. Specific steps within a Transaction Check can monitor nearly anything you have a test case for. So, this check is as good as the steps you configure for it. You can think of it as the first response or notification that a portion of critical infrastructure is down.
Webcron
5 game-changing tips for automating your bug tracking in Jira Service Desk
Bug tracking is hard. Once more for your boss in the back. Bug tracking is hard! The support agent to developer handoff is a crucial yet an easily mishandled exchange. That’s bad news if you’re striving for low time-to-resolution targets and happy customers. Luckily, Atlassian and its app vendors provide an array of tools that can help you automate your bug resolution workflows to improve speed, consistency, and communication.
timeShift(GrafanaBuzz, 1w) Issue 51
This week we’re proud to announce Grafana v5.2.1 stable is now available! Learn more and download the new stable release below, install the latest plugin updates, and check out this week’s collection of articles from around the web. Enjoy!
Goliath Performance Monitor for Hospitals Using Cerner
Goliath Performance Monitor for Hospitals Using Epic
3 phases of Prometheus adoption.
How to ensure visibility into your next-generation Kubernetes environment. Having assisted hundreds of enterprises in developing a new visibility strategy as they move to Kubernetes, I’ve learned a few things about how organizations learn, evolve and adopt a new method of application observability. Open source is usually essential to developing this understanding.
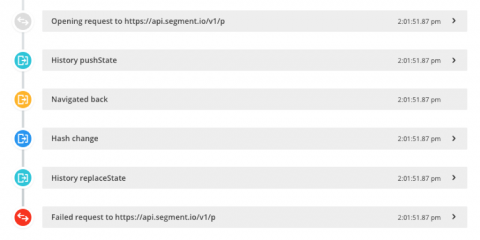
How to replicate user errors without the user with Breadcrumbs and Sessions
If you need to replicate a user error, you’ll know how difficult it can be to pinpoint the cause. Usually, you’d look at the stack trace or ask the user themselves. However, that’s a lot of guesswork, especially if the stack trace is obfuscated. We’ll show you how to replicate the error faster using Crash Reporting’s Breadcrumbs and the Real User Monitoring Sessions feature.
Monthly Snap June: Product Updates, Meetups and Events
We are planing with more events and camps in 2018/2019. Please let us know if you are interested in joining us in Washington, D.C., Tel Aviv, Berlin or Stockholm.


