Operations | Monitoring | ITSM | DevOps | Cloud


Graphite for Node.js Monitoring
In this article, we will look at how to monitor Node.js applications using Graphite and StatsD and plot the visualizations on a Grafana dashboard. Node.js is a popular framework for creating microservices. Its asynchronous nature allows for high scalability and low latency, especially for I/O bound tasks. However, it is important to have a proper monitoring setup for any application which is running in a production environment.

Stackify by Netreo Receives "Best in Show" for Performance Monitoring in the 2023 SD Times 100
Stackify by Netreo received top honors from SD Times for Performance Monitoring in the 2023 SD Times 100. Each year, SD Times editors recognize leaders in the industry across 10 different categories and designate companies with “Best in Show” honors. Retrace APM is a full lifecycle APM solution and the driving force behind the successful placement within the SD Times 100 each of the past 5 years!

It's Official, Scout is SOC 2 Certified
Valued customers, friends, and Scout APM users: Our goal has always been to provide you with the peace of mind of knowing your systems are healthy and serving your customers as expected. While security has always been paramount to us, we’ve recently made it official. We are thrilled to share with you a recent significant achievement for our team and those who trust us with their data. After many months of hard work, we have obtained our SOC 2 certification!

Demo Roundup: Operationalizing AI
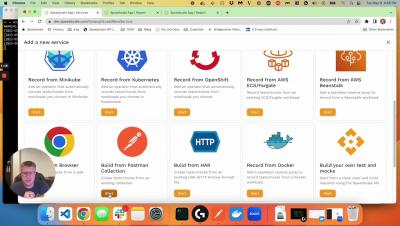
Quickly create performance and regression tests from a Postman collection

Real-Time, Automated Cost Optimization for Amazon EMR

How to Check & Monitor Disk Space Remotely with PowerShell Script
Monitoring disk space is a basic but core component of proactive IT support, critical to reducing ticket volume and maintaining system health and stability. Running low on or running out of disk space can obviously be responsible for a host of issues and user complaints — from application failures to complete system crashes — so creating alerts for when drives fall below a specified threshold is a great way to head those off.

GrafanaCON 2023 Day 2 Recap: A Grafana 10 deep-dive, Grafana Tempo and Mimir updates, home automation, and more
Today marked the second full day of GrafanaCON 2023, and all the excitement from yesterday certainly did not wane. Attendees and speakers alike continued to buzz about the Grafana 10 release — and so much more.

Release 1.40.0: Dashboard Summary Tiles, Silencing alerts, ML tweaks and more!
Another release of the Netdata Monitoring solution is here!