Operations | Monitoring | ITSM | DevOps | Cloud

Grafana 9.0: Prometheus and Grafana Loki visual query builders, new navigation, improved workflows, heatmap panels, and more!

GrafanaCONline, our annual community event designed for Grafana open source users and dashboarding enthusiasts, also marks the general availability of Grafana’s latest and greatest release. Grafana 9.0 is now available to both open source and Grafana Enterprise users, and is being rolled out to Grafana Cloud users incrementally. (The majority of instances have already been upgraded!) New Grafana Cloud users will immediately get the Grafana 9.0 experience.
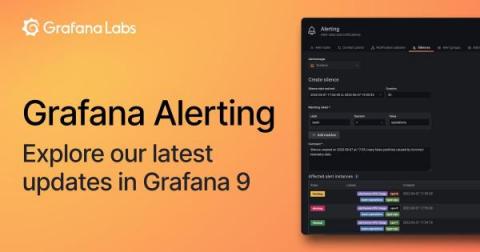
Grafana Alerting: Explore our latest updates in Grafana 9

Grafana 8 marked a major redesign in the way we do alerting. We created a unified alerting experience that implemented a workflow that operates across all of our products and combined Grafana panel alerts and Prometheus-style alerts into a single pane of glass. We built this as an open source feature first to make sure you could opt in and try it out from day one, regardless of which flavor of Grafana (OSS, Cloud, or Enterprise) works best for you.

Introducing Grafana OnCall OSS, on-call management for the open source community

Last November, we announced the launch of Grafana OnCall, an easy-to-use on-call management tool that helps reduce toil through simpler workflows and interfaces tailored for developers. Born out of Grafana Labs' acquisition of Amixr Inc., Grafana OnCall began as a cloud-only solution that became generally available to all Grafana Cloud users, on both paid and free plans, in February.

5 Ways to Reduce IT Incidents Before Your Team Succumbs to the Ticket Backlog

If you talk to any Service Desk agent, they will agree there has been an explosion in IT tickets since the transition to remote and hybrid work. Even now, there are growing challenges preventing them from being able to reduce IT incidents. In the last year, average ticket volume has risen by 16% since the pandemic, stressing already overtaxed help desk agents. This increase in tickets has led to wasted resources, poor IT service delivery and frustrated employees.

An Observability Guide From Someone with a Precarious Grasp on the Topic

I’m Phillip, a product manager here at Honeycomb. After eleven-ish months of working on our product, I totally understand observability, right? ...Kinda? Sorta? Maybe? I'm not sure—but, I have been sitting in this space long enough to be a little better than clueless. Here's my guide on the topic. I hope it helps, especially if you’re passionate about exploring alternative ways you or your team can manage today’s cloud-native applications.

Developing a pipeline-builds logging system with CircleCI webhooks and Airtable Automations

Ever since CircleCI introduced webhooks, I have been excited about the possibilities this new way of integration opens up to developers. I decided to try out one of the use cases described in the webhooks documentation. This use case involves transmitting information about build-pipeline workflows into an Airtable database. The data piped into Airtable forms a log for you to monitor your workflows and you can go as far as designing graphs and other visualizations to analyze the build data.

Learn the Latest from the Research Roundup for Modernizing Infrastructure and Operations in a Hybrid World by Gartner

Gartner breaks down modernizing I&O into five key focus areas you won’t want to miss. Unsure of how to keep-up with infrastructure reliability in an ever-changing, hybrid world? With so many cloud infrastructure and platform services (CIPS) available, do you find yourself asking, ‘How can I make sure my data center infrastructure and its operations are maximized and successful?’ If you are feeling a little challenged in any of these areas, this report will be informative.