Operations | Monitoring | ITSM | DevOps | Cloud


Introduction to Linkerd and adding an ingress to your service mesh - Jason Morgan
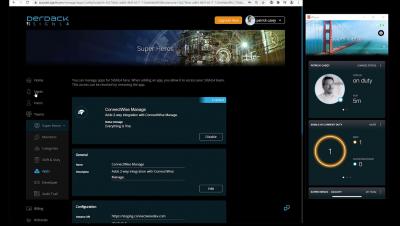
Reliable ticket and incident alerts with ConnectWise and SIGNL4

How Database Monitoring Can Boost Your Performance
Anyone who is responsible for database performance knows how demanding and challenging database performance tuning is when managing a database. One of the critical functions of this process – database monitoring – is often overlooked. Database monitoring includes identifying the right SQL for tuning, determining right way to tune and whether SQL is right thing to tune.

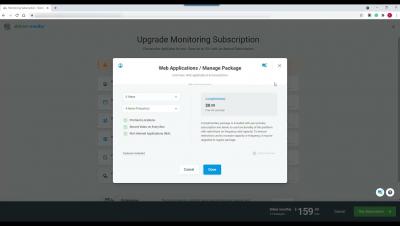
Announcing new features for Cloud Monitoring's Grafana plugin
The observability of metrics is a key factor for a successful operations team, allowing for increasingly effective visualizations, analysis, and troubleshooting. Google Cloud works with third-party partners, such as Grafana Labs, to make it easy for customers to create their desired observability stack leveraging a combination of different tools. More than two years ago, we collaborated with Grafana Labs to introduce the Cloud Monitoring plugin for Grafana.

New in Grafana Enterprise 8.0: Fine-grained access control for reporting and user management
From early on, Grafana has managed access control with three organizational permission levels (Viewer, Editor, and Admin) and one special global permission level of Grafana Admin. There are also configuration file options that can be globally applied to all users in an organization within an instance, as well as data source permissions and dashboard permissions.

How to implement dynamic config using setup workflows

Performance Tool k6 Acquired by Grafana Labs
There was a big announcement this year at GrafanaCon 2021 that performance testing tool k6 is being aquired by Grafana Labs. It was really exciting news for folks who cheer for open source because these are two giant projects. At time of this writing, k6 has over 12K stars and Grafana with a respectable 42K stars on Github as well. In full transparency, I have used both of those repos many times over the years and am a fellow stargazer.