Operations | Monitoring | ITSM | DevOps | Cloud

Practical Network Automation using Low Code Tools

Automation uses software to control network resources dynamically with minimal human intervention. It can speed up services delivery and keep the network running at peak efficiency, boosting revenues and reducing costs. With this potential, one might think that automation of telecom networks would be widespread, but that is not the case. Automation in telecom lags compared to industries like transportation, shipping, and cloud computing services.

What is incident response?

Incident response is the process of responding to and managing the aftermath of a security breach or cyber attack. It involves a systematic approach to identifying, containing, and mitigating the consequences of an incident in IT, OT or Cybersecurity, with the goal of minimizing the impact on the organization and its stakeholders. It is often exclusively related to Cybersecurity.

How to start with Kubernetes monitoring in Grafana Cloud

This video provides a comprehensive guide to initiating Kubernetes monitoring within Grafana Cloud, detailing a straightforward, step-by-step approach for installing the Helm chart on your cluster. It further ensures that you can validate the health and integrity of the data underpinning the solution, setting a solid foundation for effective monitoring practices. Ideal for both beginners and experienced users, this tutorial is designed to streamline your monitoring setup process with precision and ease.

Are organizations finding value in the incident metrics they track?

See the full report—Incident metrics pulse: How organizations are measuring their incident management What metrics do you look at to measure how efficient your incident response is? This is a question we get asked all the time and one we empathize with deeply. While there are several well-established incident metrics that organizations commonly use, like MTTR and raw counts of incidents, a vast number of them are ineffective, or worse still entirely misleading.

Practical Zephyr - Devicetree semantics (Part 4)

Having covered the Devicetree basics in the previous article, we now add semantics to our Devicetree using so-called bindings: For each supported type, we’ll create a corresponding binding and look at the generated output to understand how it can be used with Zephyr’s Devicetree API. Notice that we’ll only look at Zephyr’s basic Devicetree API and won’t analyze specific subsystems such as gpio in detail.

Kubernetes alerting: Simplify anomaly detection in Kubernetes clusters with Grafana Cloud

Despite the widespread adoption of Kubernetes, many DevOps teams and SREs still struggle to troubleshoot issues because of all the complexity that comes with the open source container orchestration platform. That’s why we developed Kubernetes Monitoring, an application in Grafana Cloud you can use to visualize and alert on your Kubernetes clusters.

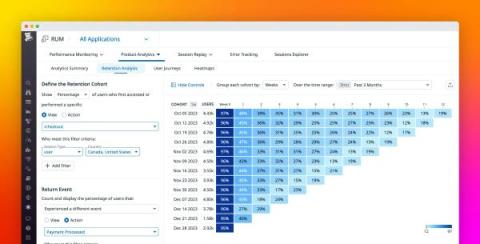
Measure long-term user engagement with Datadog Retention Analysis

It’s relatively easy to study the immediate impact of new releases by analyzing short-term changes in user behavior or system activity. However, this information doesn’t tell you much about the long-term viability of your application, which depends less on the novelty of major application updates and more on sustained usability.

How Do You Monitor Dynamic Amazon Web Services (AWS) Cloud Architectures?

david.arrowsmith • Feb 15, 2024 Comprehensive visibility across all your Amazon Web Services (AWS) environments plays an important part in maintaining the availability, and performance of applications hosted in AWS. Leveraging Interlink Software’s AIOps and Business Service Observability Platform, enterprises can greatly enhance their capability to monitor, manage and optimize the health of applications and act swiftly resolving issues before they impact on customer experience.