Operations | Monitoring | ITSM | DevOps | Cloud

Tracing

The latest News and Information on Distributed Tracing and related technologies.

How to Deploy the Splunk OpenTelemetry Collector to Gather Kubernetes Metrics

With Kubernetes emerging as a strong choice for container orchestration for many organizations, monitoring in Kubernetes environments is essential to application performance. Kubernetes allows developers to develop applications using distributed microservices introducing new challenges not present with traditional monolithic environments. Understanding your microservices environment requires understanding how requests traverse between different layers of the stack and across multiple services.

OpenTelemetry Browser Instrumentation

One of the most common questions we get at Honeycomb is “What insights can you get in the browser?” Browser-based code has become orders of magnitude more complex than it used to be. There are many different patterns, and, with the rise of Single Page App frameworks, a lot of the code that is traditionally done in a backend or middle layer is now being pushed up to the browser. Instead, the questions should be: What insights do frontend engineers want?

How to Keep Traces for Slow and Failed Requests

Today we are introducing Local Tail-Based sampling in Kamon Telemetry! We are going to tell you all about it in a little bit but before that, let’s take a couple minutes to explore what is sampling, how it is used nowadays, and what motivated us to including local tail sampling in Kamon Telemetry.

Announcing Service Performance Monitoring in Early Access

Today, we’re thrilled to announce the early access of our Service Performance Monitoring capability. As today’s DevOps teams know all too well, monitoring application requests in modern microservices architectures is extremely difficult. Requests typically travel across a vast ecosystem of microservices and, as a result, it is often a significant challenge to pinpoint a specific failure in one of these underlying services.

Generate span-based metrics to track historical trends in application performance

Tracing has become essential for monitoring today’s increasingly distributed architectures. But complex production applications produce an extremely high volume of traces, which are prohibitively expensive to store and nearly impossible to sift through in time-sensitive situations. Most traditional tracing solutions address these operational challenges by making sampling decisions before a request even begins its path through your system (i.e., head-based sampling).

How Using Annotations with OpenTelemetry Can Lower Your MTTR

When it comes to gaining control over complex distributed systems, there are many indicators of performance that we must understand. One of the secrets to understanding complicated systems is the use of additional cardinality within our metrics, which provides further information about our distributed systems’ overall health and performance. Developers rely on the telemetry captured from these distributed workloads to determine what really went wrong and place it in context.

Observability into Your FinOps: Taking Distributed Tracing Beyond Monitoring

Distributed tracing has been growing in popularity as a primary tool for investigating performance issues in microservices systems. Our recent DevOps Pulse survey shows a 38% increase year-over-year in organizations’ tracing use. Furthermore, 64% of those respondents who are not yet using tracing indicated plans to adopt it in the next two years. However, many organizations have yet to realize just how much potential distributed tracing holds.

Logs and tracing: not just for production, local development too

We're a small team of engineers right now, but each engineer has experience working at companies who invested heavily in observability. While we can't afford months of time dedicated to our tooling, we want to come as close as possible to what we know is good, while running as little as we can- ideally buying, not building. Even with these constraints, we've been surprised at just how good we've managed to get our setup.

Grafana Tempo 1.2 released: New features make monitoring traces 2x more efficient

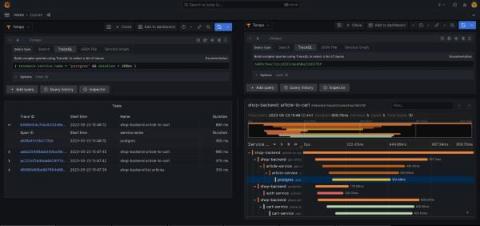
Grafana Tempo 1.2 has been released! Among other things, we are proud to present both our first version to support search and the most performant version of Tempo ever released. There are also some minor breaking changes so make sure to check those out below. If you want ALL the details you can always check out the v1.2 changelog, but if that’s too much, this post will cover all the big ticket items.