Operations | Monitoring | ITSM | DevOps | Cloud
The latest News and Information on Distributed Tracing and related technologies.
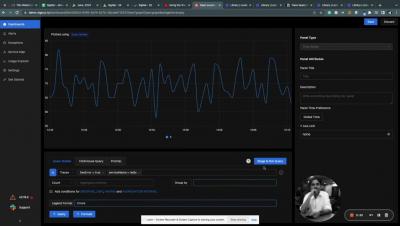
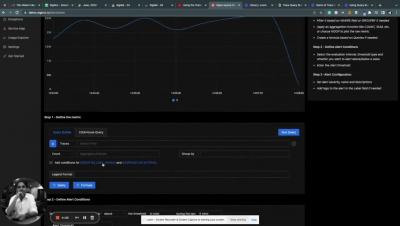
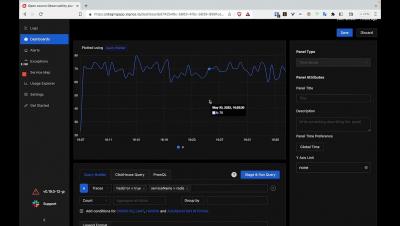
Query Builder for Traces and Logs in Alerts Tab
Logit.io Launches Platform Release With Latest OpenSearch Features
What is OpenTelemetry
Learn what is OpenTelemetry: The open-source observability framework for collecting and processing telemetry data from applications and systems.
Best Practices for using Amazon Distro for OpenTelemetry | Last9 Community Talks
Collecting Kubernetes Data Using OpenTelemetry
Running a Kubernetes cluster isn’t easy. With all the benefits come complexities and unknowns. In order to truly understand your Kubernetes cluster and all the resources running inside, you need access to the treasure trove of telemetry that Kubernetes provides. With the right tools, you can get access to all the events, logs, and metrics of all the nodes, pods, containers, etc. running in your cluster. So which tool should you choose?
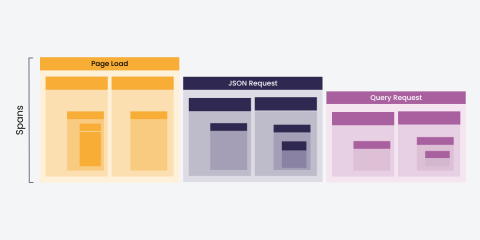
What are Spans in Distributed Tracing?
In modern software development, distributed systems have become increasingly common. As systems grow more complex and distributed, it can be challenging to understand how requests or messages move through the system and where bottlenecks may occur. This is where distributed tracing comes in. Distributed tracing is a technique that allows developers and operators to monitor and understand the behavior of complex systems.
Complete Guide to tracing Kafka clients with OpenTelemetry in Go
Set Up Tracing for a Node.js Application on AppSignal
Node.js is a very popular JavaScript runtime for the backend. Its usage has grown steadily in the past years. Some notable users of Node.js include Netflix, PayPal, Uber, and eBay. In this post, you will learn how to add tracing to a Node.js application on AppSignal. You will use an existing Quotes app that talks to a PostgreSQL database to fetch the quotes. Let’s get going!


