Operations | Monitoring | ITSM | DevOps | Cloud

Tracing

The latest News and Information on Distributed Tracing and related technologies.

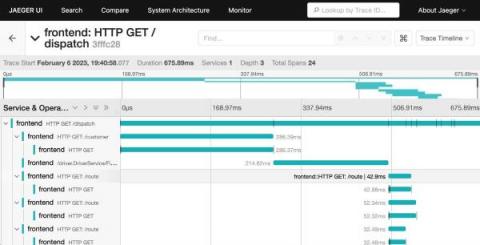
Jaeger Persistent Storage With Elasticsearch, Cassandra & Kafka

Running systems in production involves requirements for high availability, resilience and recovery from failure. When running cloud native applications this becomes even more critical, as the base assumption in such environments is that compute nodes will suffer outages, Kubernetes nodes will go down and microservices instances are likely to fail, yet the service is expected to remain up and running.

Logz.io Celebrates the Release of OpenTelemetry v.1.0

OpenTelemetry 1.0 (Otel) is finally here (in fact, 1.0.1). The announcement brings the industry closer to a standard for observability. OpenTelemetry v1.0.1 will focus solely on tracing for now, but work continues on integrations for metrics and logs. We are still a long way off from this vision becoming reality. Metrics today are in beta, and this is where the community focus is being applied. Logging is even earlier in its life lifecycle.
Getting Started with Java & OpenTelemetry

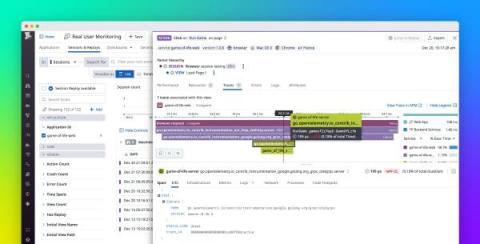
It’s easy to get started with Java and Honeycomb using OpenTelemetry. With Honeycomb being a big supporter of the OpenTelemetry initiative, all it takes is a few parameters to get your data in. In this post, I will walk through setting up a demo app with the OpenTelemetry Java agent and show how I was able to get rich details with little work by combining automatic instrumentation from the agent with custom instrumentation in the code.

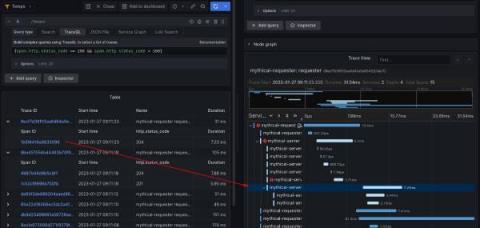
Instrumenting a .NET web API using OpenTelemetry, Tempo, and Grafana Cloud

OpenTelemetry is a CNCF project that standardizes observability (logs, metrics, and traces) across many languages and tools. Today we will look at how we can use the OpenTelemetry .NET library to instrument a .NET 5.0 web API, to offload traces to Tempo and logs to Loki in Grafana Cloud. Grafana Cloud now has a free plan. Set up your account and follow along!

The Splunk plugin for Grafana now supports data links for jumping directly from logs to traces

Hey there! This is Éamon Ryan from the Solutions Engineering team. Very recently the Splunk data source plugin, which is available with a Grafana Enterprise license, had a new release: v2.1.0. While it added a few good bug fixes for edge cases, the biggest change, I think, was the addition of support for data links! Data links actually show up in a few places inside Grafana.

Auto-instrumenting a Java Spring Boot application for traces and logs using OpenTelemetry and Grafana Tempo

Auto-instrumentation is a subject I have not had much experience with. Here at Grafana Labs, we primarily develop in Go, which doesn’t afford such luxuries. However, there is an enormous amount of interest from the community in Java auto-instrumentation, so I set out to determine what was possible using the shiny new OpenTelemetry auto-instrumentation libraries.