Operations | Monitoring | ITSM | DevOps | Cloud

Latest Posts

Monitor End User Experience on Citrix Workspace

Goliath Performance Monitor is the only comprehensive Citrix monitoring and troubleshooting solution that brings together Citrix monitoring data, end user experience performance metrics and the supporting IT elements that can impact end users experience when using Citrix. Comprehensive Citrix monitoring requires full visibility into everything the user does from the initial logon to working within their Citrix session and the IT infrastructure that supports this activity.

Rancher 2.5 Keeps Customers Free from Kubernetes Lock-in

Rancher Labs has launched its much-anticipated Rancher version 2.5 into the cloud-native space, and we at LSD couldn't be more excited. Before highlighting some of the new features, here is some context as to how we think Rancher is innovating. Kubernetes has become one of the most important technologies adopted by companies in their quest to modernize.

Microsoft Hyper-V: Reports You Want to Check

If you use Microsoft Hyper-V every day, you may want to spend some time producing and analyzing reports. Reports can help you find where the virtualization software is lagging and how it’s behaving. Monitoring and reporting can help optimize virtual machines, especially if you run many of them on a single system. What is Hyper-V? It’s virtualization software that specifically provides hardware virtualization.

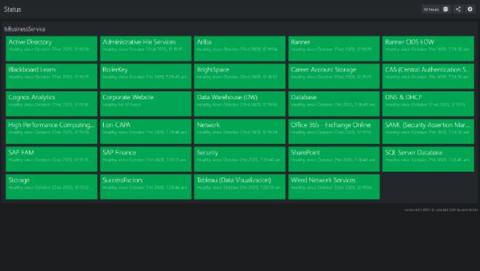
Share application status with the Business

Once your monitoring is operational for a while, it becomes evident that infrastructure monitoring alone is not enough. Sure, SCOM is excellent when focused on an infrastructure level problem. Do you have an alert that your Windows server is running out of space? Check. Can you check to see if your SQL Server has had a lot of deadlocking recently? Check. Do you know if your Linux server is out of swap space? Can you report on how fast it has been running out? Check.

Enhance DEM with Real User Monitoring

Today’s Tip focuses on one of Catchpoint’s core functionalities: our real user monitoring or RUM solution. While recording and replaying transactions with Catchpoint’s synthetic monitoring offering is undeniably robust and powerful thanks to our 830+ worldwide monitoring locations, it doesn’t change the inherent value of live data when it comes to analyzing real user experience.

The best complement for an IoT solution using a Raspberry Pi

Pandora FMS is a proactive, advanced, flexible and easy-to-configure monitoring tool according to each business. It gets integrated into all the needs of servers, network computers, terminals and whatever needs to be monitored. In this article, we will focus on monitoring openHAB (Smart Home Solution), using the software agent installed on our Raspberry Pi (this article applies to both Pandora FMS Community and Enterprise versions).

Introducing the Splunk Observability Suite

Today is an exciting day for Splunk! In just 12 months since the acquisition of SignalFx and Omnition, our vision of a fully integrated Observability Suite is now a reality! As IT and DevOps teams strive to keep up with ever changing business requirements and deliver flawless customer experiences, we’re seeing the pace of digital and cloud initiatives accelerate.

Splunk Log Observer: Fast and Powerful Log Investigation for DevOps Teams

When it comes to DevOps, Splunk has a lot to say at .conf20. There’s a lot to digest from new product names to introducing new products to create a complete observability experience. We announced the Splunk Observability Suite, which creates a seamless workflow across monitoring, investigation and troubleshooting tasks. We also extended our portfolio with Splunk Real User Monitoring, which provides front end engineers better insights into performance.

Running Elastic Cloud on Kubernetes from Azure Kubernetes Service

It's safe to say that It's safe to say that Kubernetes is the de facto standard for orchestrating containers and the applications running in them. As the standard, a variety of managed services and orchestration options are available to choose from. In this blog post, we're going to take a look at running the Elastic Stack on Azure Kubernetes Service (AKS) using Elastic Cloud on Kubernetes (ECK) as the operator.

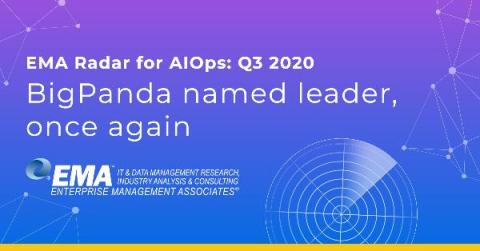
"The clearest and most singular footprint for AIOps": BigPanda named leader once again in EMA's Radar Report on AIOps

Leading analysts continue to acknowledge BigPanda’s leading role in the AIOps ecosystem. Earlier this year the GigaOm AIOps Radar report placed BigPanda in the leader section for the company’s strong market impact as a platform that delivers event correlation at scale.