Operations | Monitoring | ITSM | DevOps | Cloud

%term

Asset Tracking Solutions To Help Reduce Time Searching For Equipment | Zebra

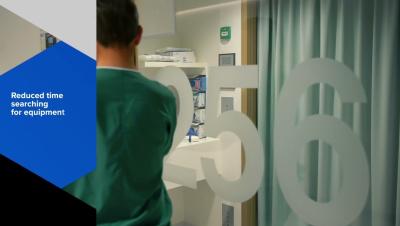
When time spent locating missing assets or medical supplies can be reduced, nursing hours can be returned to where it matters the most, with patients. Through the use of Zebra’s asset tracking solutions, hospitals can increase the level of visibility of their assets, reduce inventory costs, and ultimately help improve patient care delivery.

Personal Alarms To Help Improve Staff And Patient Safety | Zebra

Employee and patient safety are critical. Increasingly, incidents are reported of healthcare staff experiencing violence in the workplace. Being exposed to all sorts of aggression can be intimidating for clinicians. It is important for healthcare organizations to take precautionary measures and implement tools and solutions to increase the safety of their employees and patients.

Meta's Big Bet on AI Wearables

Meta is making a massive push into AI wearables, with at least six new devices launching in 2025. But here’s the catch—this wasn’t originally about AI. Meta built its hardware for the metaverse, only to find itself at the center of the AI revolution. With over 1 million Ray-Ban smart glasses already sold (and a goal of 5 million in 2025), it’s clear there’s demand. But can Meta actually scale this initiative from within, or will they lean on brand partnerships like Oakley to expand?

An In-Depth Guide to Java Performance Monitoring for SREs

If you've ever had a Java application slow down in production and struggled to pinpoint the cause, you know the pain of performance issues. Java is a powerful, high-level language, but it doesn’t come without challenges—especially when it comes to resource management, garbage collection, and thread handling. This guide will take you through everything you need to know about Java performance monitoring, from key metrics to tools and best practices.

Integrating OpenTelemetry with Grafana for Better Observability

Modern application observability is essential for ensuring system performance, diagnosing issues, and optimizing user experiences. OpenTelemetry (Otel) and Grafana serve as two key components in achieving end-to-end visibility. While OpenTelemetry focuses on instrumenting applications to collect telemetry data, Grafana specializes in visualizing this data, making it actionable and insightful.

OpenTelemetry UI: The Ultimate Guide for Developers

If you’ve ever struggled with understanding distributed traces, managing metrics, or debugging complex applications, OpenTelemetry is your best friend. But what about the OpenTelemetry UI? How do you visualize and interact with all that telemetry data? In this guide, we’ll explore the best ways to use OpenTelemetry’s UI options, from setting up a proper observability stack to choosing the right front-end visualization tools.

How APM and synthetic monitoring work together for better performance

Imagine this: A customer tries to log in to your app, but the page takes too long to load. Frustrated, they leave. Meanwhile, your IT team has no clue there was an issue—until complaints start pouring in. Sound familiar? Performance lags are the new downtime. Lags are not just an inconvenience—they lead to lost revenue and frustrated users. To prevent this, organizations turn to application performance monitoring (APM) and synthetic monitoring to maintain peak application performance.

Transform Data with the New Python Processing Engine in InfluxDB 3

In early January, we announced the launch of InfluxDB 3 Core and InfluxDB 3 Enterprise in public alpha. One of the newest included features is the InfluxDB 3 Processing Engine–a Python-based VM built to enable data transformation, enrichment, downsampling, alerting, and more, all from within the database itself. One month later, we’re excited to deliver a big update enabling new ways to interact with and transform your data.

Logging vs. Metrics

When discussing observability, the “big 3” - logs, metrics, and traces, always get mentioned. But for some, more data doesn’t always mean better. Our lead engineer, JJ, had some advice to share about how logs may not be necessary for everyone. Simplifying your observability stack isn’t difficult - you just need to be intentional with implementation. Check out more MetricFire blog posts below, and our hosted Graphite service! Get a free trial and start using MetricFire now!