Operations | Monitoring | ITSM | DevOps | Cloud

The latest News and Information on DevOps, CI/CD, Automation and related technologies.

Auto-scaling of Intel FlexRAN components based on MicroK8s and Ubuntu real-time kernel support

RAN has incrementally evolved with every generation of mobile telecommunications, thus enabling faster data transfers between user devices and core networks. The amount of data has increased more than ever with an increase in the number of interlinked devices. With existing network architectures, challenges lie in handling increasing workloads with the ability to process, analyse and transfer data faster. The 5G ecosystem requires virtual implementations of RAN.

A practical guide to capturing production traffic with eBPF

Monitoring HTTP sessions offers a potentially powerful way to gain visibility into your web servers, but in practice, doing so can be complex and resource-intensive. Extended Berkeley Packet Filter (eBPF) technology allows you to overcome these challenges, giving you a simple and efficient way to process application-layer traffic for your troubleshooting needs.

How to Create K6 Load Tests from API Recordings

Load testing is one of the most common ways to test the resiliency of your applications. In this blog we show how recording production data with Speedscale and exporting to a K6 load tests gives you the best of both worlds. Whether or not it’s important for your organization, there are clear benefits to be had from implementing these types of tests. By doing so, you can: When it comes to load testing, two of the most modern tools are Speedscale and K6.
Sponsored Post

How to Test Autoscaling in Kubernetes

In an ideal world, you want to have precisely the capacity to manage the requests of your users, from peak periods to off-peak hours. If you need three servers to attend to all the requests at peak periods and just one server at off-peak hours, running three servers all the time is going to drive up expenses, and running just one server all the time is going to mean that during peak periods, your systems will be overwhelmed and some clients will be denied service.

Keeping Track of Kubernetes Deprecated Resources

It’s a fact of life: as the Kubernetes API evolves, it’s periodically reorganized or upgraded. This means some Kubernetes resources can be deprecated and later removed. We deserve to keep track of those deprecations and removals easily. For that, we have just released the new deprecated-api-versions policy for Kubewarden, our efficient Kubernetes policy engine that runs policies compiled to Wasm.

Cluster Monitoring with Prometheus and Rancher

In this article, we present an overview of cluster monitoring using Rancher and Prometheus as well as provide some brief setup tutorials for both tools. We further introduce a metric visualization tool called Grafana that transforms your Prometheus time-series data into graphs and visualizations. MetricFire specializes in monitoring systems. You can use this product with minimal configuration to gain in-depth insight into your environment.

How to Monitor Redis Performance

In this article, we are going to look at how to monitor Redis performance using Prometheus. This will allow Redis Administrators to centrally manage all of their Redis clusters without setting up any additional infrastructure for monitoring. To follow the steps in this blog, sign up for the MetricFire free trial, where you can use Graphite and Grafana directly on our platform.

How to monitor NGINX web servers?

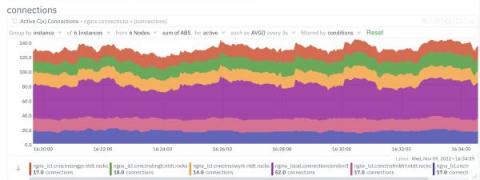
Web servers are among the most important components in modern IT infrastructures. They host the websites, web services, and web applications that we use on a daily basis. Social networking, media streaming, software as a service (SaaS), and other activities wouldn’t be possible without the use of web servers. And with the advent of cloud computing and the movement of more services online, web servers and their monitoring are only becoming more important.