
Featured Post
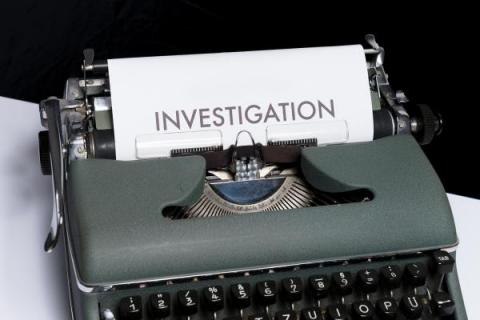
After action reports: post-incident investigations
When something unexpected happens within the digital operations remit, software engineers put on their deerstalker hats and wax their fussy little moustaches-metaphorically. It's their time to play detective as they unravel the evidence and create the reports to explain the recent IT incident. But unlike with a hat-wearing Sherlock Holmes or a hirsute Hercule Poirot, cliff-hanger endings are not encouraged in software engineering.