Operations | Monitoring | ITSM | DevOps | Cloud

Icinga Kubernetes Helm Charts

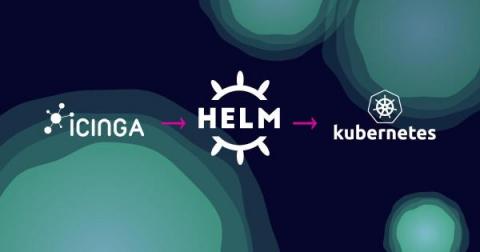
Before attending Icinga Berlin in May this year, Daniel Bodky and Markus Opolka from our partner NETWAYS developed the very first Icinga Kubernetes Helm Charts and released it in an alpha version. If you have ever wanted to deploy an entire Icinga stack in your Kubernetes cluster, now is your chance. I also want to highlight Daniel’s talk again on how Icinga can run on Kubernetes and the challenges involved.
Monitoring Real-Time Stock Quotes with MetricFire

In the ever-evolving stock market landscape, immediate access to accurate information is crucial for investors and financial experts alike. In this piece, titled "Monitoring Real-Time Stock Quotes with MetricFire," we dive deep into the realm of advanced technology, focusing on its potential to transform stock market tracking and decision-making procedures.

Fleet: Multi-Cluster Deployment with the Help of External Secrets

Fleet, also known as “Continuous Delivery” in Rancher, deploys application workloads across multiple clusters. However, most applications need configuration and credentials. In Kubernetes, we store confidential information in secrets. For Fleet’s deployments to work on downstream clusters, we need to create these secrets on the downstream clusters themselves.

Perform Distributed Tracing with Zipkin

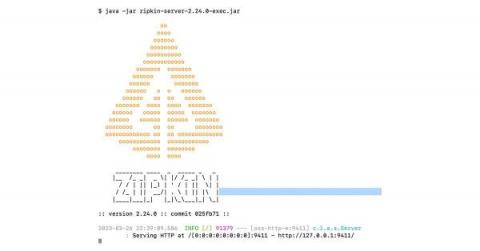
Open source Zipkin offers a robust set of features that make it easier for developers to understand and optimize complex distributed systems. Distributed tracing is a technique you can use to trace and monitor requests propagating through a distributed system. It can work in environments where multiple services process a request, making it an essential tool for modern microservices architectures. Zipkin is an open source distributed tracing system for monitoring and troubleshooting complex systems.

ServiceNow and Guidewire collaborate to improve insurance experiences

Insurance companies need to provide exceptional customer experiences. This has been a priority for years. However, insurance teams continue to be bogged down by manual processes and siloed point solutions. Companies need intelligent and connected solutions that streamline processes, improve operational efficiency, and enable easy, empathetic experiences.

Logic App Best Practices, Tips, and Tricks: #34 How to validate JSON messages

In the last three blog posts, we explain how to validate null inside Logic App and specifying json schema elements/properties and perform JSON Schema restrictions in Logic Apps. Today and to finish, at least for now this topic, I will speak about another best practice, Tips and Tricks that you must consider while designing your business processes (Logic Apps): Validating JSON messages against schema in Logic Apps.

Quickly and securely enable monitoring for your entire Google Cloud environment

A foundational component of monitoring Google Cloud environments with Datadog is our Google Cloud Platform integration. This integration continuously collects metrics from all of your Google Cloud services and enriches them with tags, enabling you to scope dashboards and monitors to the relevant resources and seamlessly pivot across logs, metrics, and traces inside the Datadog platform.

Why Observability is Better with a Storage-less Architecture

In today’s data-driven world, the need for comprehensive observability has never been greater. Organizations rely on observability to gain insights into their systems’ and applications’ performance, availability, and behavior. However, the traditional approach to observability, which involves ingesting, processing, and storing massive amounts of data, is becoming increasingly challenging and expensive.