Monitoring your on-premise or hybrid infrastructure means keeping track of potentially thousands of devices, any one of which could be a point of failure. Additionally, silos between application and network teams can create visibility gaps that complicate troubleshooting. For network engineers investigating bottlenecks, being able to view real-time infrastructure health and performance data alongside application metrics is essential for ensuring their organizations meet key SLOs.
In this episode, Jason chats with Aaron Clark, Director of Developer Advocacy at the Royal Bank of Canada. Aaron shares what it was like starting out as a developer at RBC and working in early cloud development, and then transitioning to his role as a developer advocate. Jason and Aaron talk about the value applying open source principles within organizations, or “innersource.” Their time ends with a discussion on continuing education and how to keep learning.
A monitoring tool and its backend database Monitoring platforms such as eG Enterprise collect large numbers of metrics and data points about the applications and infrastructure being monitored. As the complexity of the applications, the number of tiers and the scale of the infrastructure grows, so do the number of metrics that need to be analyzed. Even in a mid-sized IT infrastructure, there may be over 100s of thousands of metrics collected and analyzed over time.
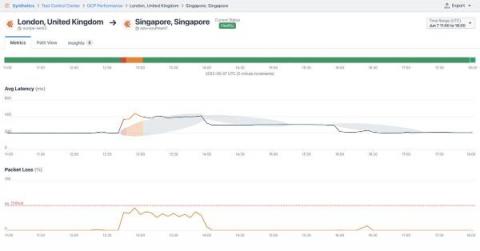
On Tuesday, June 7, internet users in numerous countries from East Africa to the Middle East to South Asia experienced an hours-long degradation in service due to an outage at one of the internet’s most critical chokepoints: Egypt. Beginning at approximately 12:25 UTC, multiple submarine cables connecting Europe and Asia experienced outages lasting over four hours. As I show below, the impacts were visible in various types of internet measurement data to the affected countries.
I can’t believe that OpenObservability Talks podcast is already celebrating its second anniversary. It feels like just yesterday I wrote the summary of the summary of the first year, sharing the hectic times of starting a podcast in the midst of the COVID-19 global pandemic. The pandemic has been with us most of this year too, but it didn’t stop us from bringing the latest on the best of breed open source observability.
Did you get to attend the excellent SLOconf last month? With four different tracks and over 60 talks - covering everything from defining an SLO to the financial framing of error budgets, you, like us, may have missed a couple of things. In this handy recap, we take you through some of the juiciest sessions and point you to a few you may have overlooked. Luckily, SLOconf 2022 was designed for while-you’re-working participation and all the talks are still available.
We know that everyone’s code story may be a little different, but speedier repos are something everyone can get behind. No matter where your developer adventures take you, it is important to keep all your code, configuration, and media assets together, and never leave a file behind. That is why we have been working on a lot of performance improvements for Git LFS users and have added Bitbucket Workspace support for Bitbucket Server users!
For years, Netcool has been omnipresent in many IT Operations organizations. That, combined with the sheer utility it once brought to the table, sometimes gave it a special sort of nostalgic reverence in IT Operations circles. But with all due respect to Netcool, there’s also little doubt the platform’s real-world utility has waned in the era of cloud and hybrid ops.