Operations | Monitoring | ITSM | DevOps | Cloud

Latest News

Enable Kubernetes Pod Security Policy with kube-psp-advisor

Kubernetes Pod Security Policy is a mechanism to enforce best security practices in Kubernetes. In this tutorial, we will explain how to enable Kubernetes Pod Security Policy across your cluster using kube-psp-advisor to address the practical challenges of building an adaptive and fine-grained security policy on Kubernetes in production.

Performance monitoring with OpenTracing, OpenCensus, and OpenMetrics

If you are familiar with instrumenting applications, you may have heard of OpenMetrics, OpenTracing, and OpenCensus. These projects aim to create standards for application performance monitoring and collecting metric data. Although the projects do overlap in terms of their goals, they each take a different approach to observability and instrumentation.

Avoiding Junk-Drawer Classes in Ruby

Because Ruby is an object-oriented language, we tend to model the world as a set of objects. We say that two integers (x and y) are a Point, and a Line has two of them. While this approach is often useful, it has one big problem. It privileges one interpretation of the data over all others. It assumes that x, and y will always be a Point and that you'll never need them to act as a Cell or Vector. What happens when you do need a Cell? Well, Point owns the data. So you add a your cell methods to Point.

7 Signs of an Attempted Data Breach- and How to Stop It in Its Tracks

Data breaches come in all shapes, sizes, and levels of exposure. They can range from a couple of log files unintentionally left available to the public to the leak of hundreds of thousands of users’ personally identifiable information (PII). Don’t think that just because you have a secure network, a leak can’t happen to you.

When it comes to system metrics, skip vanity and promote transparency

At Hosted Graphite, our users rely on us for a heavy-duty component of their business: monitoring their stack. This is a responsibility we take very seriously and we realize how critical it is for a user to know right away whether the problem detected is related to their own systems or to our system. That’s why we choose to publish our internal system metrics to our public status page.

5 Best Practices for Getting the Most out of RUM

More than likely you’re here because you’ve made the leap or are thinking of making the leap in investing in a Real Monitoring Solution. Congrats. You’re one step closer to having the power of user metrics working in your favor. Real User Monitoring is a way for your users to communicate with you how satisfied they were when they interacted with your website or webapp, so how can you be sure you’re listening correctly?

Master IE11 Developer Tools in 2019

Internet Explorer 11 is an updated version of the IE web browser developed by Microsoft. And if previous versions saw you move to other browsers, then this article will help you reconsider. The previous versions of Internet Explorer didn’t have a developer-friendly browser, but vast improvement can be seen in its latest version. The built-in developer tools in IE11 now make developing and debugging code in the browser a simple task.

From value-add to strategic partner: Technical Account Managers

When the National Bank of Canada set off on a cultural and digital transformation, the most important objective was putting people first, both their clients and employees. They needed better transparency and collaboration across teams, and knew that consolidating and standardizing their applications would help them achieve this.

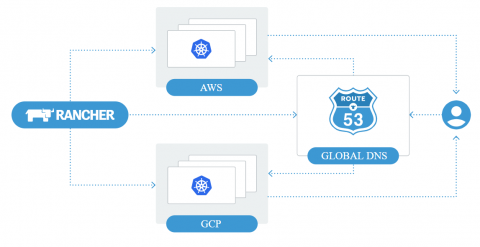
Introducing Multi-Cluster Applications in Rancher 2.2 Preview 2

I’m excited to announce the release of Rancher 2.2 Preview 2, which contains a number of powerful features for day two operations on Kubernetes clusters. Please visit our release page or the release notes to learn more about all of the features we shipped today. In this article I introduce one of the features: multi-cluster applications. Read on to learn how this will dramatically reduce your workload and increase the reliability of multi-cluster operations.

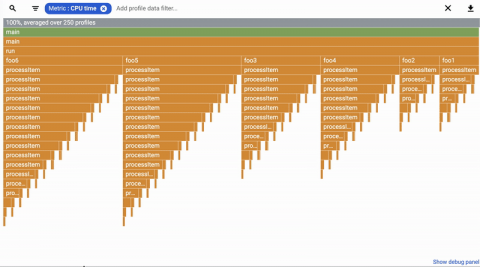
Stackdriver Profiler adds more languages and new analysis features

Historically, cloud developers have had limited visibility into the impact of their code changes. Profiling non-production deployments doesn’t yield useful results, and profiling tools used in production are typically expensive, with a performance impact that means that they can only be used briefly and on a small portion of the overall code base.