Operations | Monitoring | ITSM | DevOps | Cloud

Latest News

Monitor your Pinecone vector databases with Datadog

Pinecone is a vector database that helps users build and deploy generative AI applications at scale. Whether using its serverless architecture or a hosted model, Pinecone allows users to store, search, and retrieve the most meaningful information from their company data with each query, sending only the necessary context to Large Language Models (LLMs). By providing the ability to search and retrieve contextual data, Pinecone enables you to reduce LLM hallucinations and enhance data security.

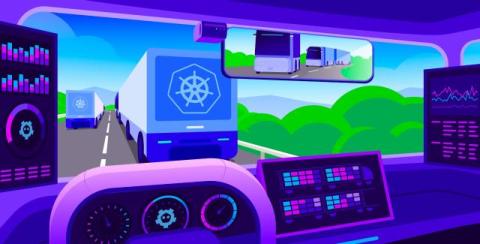
How to support a growing Kubernetes cluster with a small etcd

Etcd plays a critical role in your Kubernetes setup: it stores the ever-changing state of your cluster and its objects, and the API server uses this data to manage cluster resources. As your applications thrive and your Kubernetes clusters see more traffic, etcd handles an increasing amount of data. But etcd’s storage space is limited: the recommended maximum is 8 GiB, and a large and dynamic cluster can easily generate enough data to reach that limit.

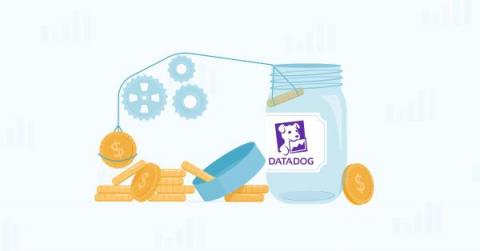
Your Guide To Datadog Cost Optimization: 7 Tips For Reducing Spend

As cloud systems become increasingly sophisticated, you want a cloud monitoring platform that helps you identify, isolate, and fix root-cause issues. Meanwhile, engineering leaders are under increasing pressure to reduce technology costs as the global economic outlook remains uncertain. With Datadog, you can observe, monitor, analyze, and report on the health of your infrastructure, applications, and services in any cloud and at scale.

Reflecting on 2024: A year of growth and innovation for CloudSpend

CloudSpend Wrapped 2024 As the holiday spirit fills the air, it’s time to look back at a truly transformative year for ManageEngine CloudSpend. With a suite of groundbreaking features, 2024 saw CloudSpend evolve into a powerful tool for managing multi-cloud costs effectively. Let’s revisit the key milestones and share some exciting glimpses of what lies ahead.
Sponsored Post

Enhanced Monitoring for Citrix Environments

Citrix has become a cornerstone of modern IT infrastructures, particularly as organizations adapt to remote and hybrid work models. By providing secure, scalable solutions for delivering virtualized applications and desktops, Citrix enables businesses to centralize their IT operations while ensuring employees can access the resources they need from any location. Key solutions, such as Citrix Virtual Apps and Desktops (VAD) and Citrix Application Delivery Controller (ADC), empower organizations to manage virtualized workloads efficiently, regardless of the underlying hardware or cloud environment.

Jitter vs Latency: Definitions and Differences for Better Network Performance

If you’ve ever experienced choppy audio or video calls, slow website loading, or laggy gaming sessions, chances are you’ve dealt with either latency or jitter issues – or possibly both. These problems plague networks both large and small, from Fortune 500 companies to neighborhood coffee shops offering free WiFi.

Diving into .NET 9.0, Blazor, and Observability with Coralogix

So, there I was, a newbie to.NET 9.0, Blazor, and Coralogix, standing on the precipice of observability in a world of production bugs and development mysteries. As an Agile enthusiast, I’m well versed in all things “observability” and how it’s a game-changer for root cause analysis, especially in today’s rapid, iterative development cycles. Observability is like getting X-ray vision into your application to understand what’s truly happening based on system outputs.

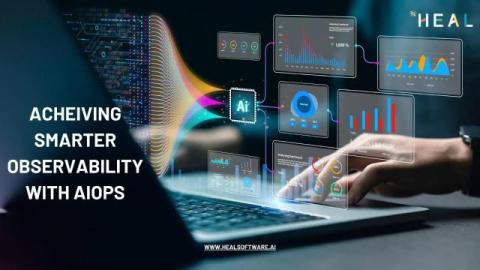
Observability to AIOps: Transforming Anomaly Detection for Modern Enterprises

As businesses increasingly digitize operations, IT systems are evolving into complex, distributed ecosystems. Applications run across multi-cloud environments, microservices power critical processes, and data flows in real time across countless touchpoints. While this transformation drives agility and scalability, it introduces significant challenges: hidden anomalies that can disrupt operations, frustrate users, and damage revenue.

New improvement: Component filter tags for easier filtering

One of StatusGator’s most important cloud service monitoring features is component filtering. Many services have multiple components such as regions, products, or features and not every component may be relevant to you. Our new component filter tags help you quickly identify how many components of a service you’re currently monitoring. This makes it easier to ensure your notifications are focused on what matters most.