Operations | Monitoring | ITSM | DevOps | Cloud

Latest News

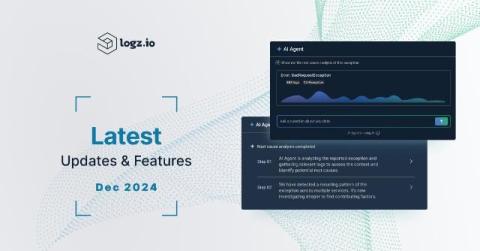
Latest Product Updates and Features in Logz.io | December 2024

We’re rolling out new visualization capabilities in the Explore log management interface that are available now in some accounts and will be added to all in the coming weeks and months. With these updates you can: Warm Tier: There is now a new option for log storage and access that bridges the gap between high-performance Hot storage and the low-cost Cold Tier. Reach out to your customer success team for more information.

Sending Alerts Using Prometheus and Alertmanager

Continuing our series on setting up Prometheus in a container, this article provides a step-by-step guide for how to configure alerts in Prometheus. We will add alerting rules and deploy Prometheus Alertmanager with Slack integration. If you follow the steps in this article, you will end up with a containerized setup for: Let's get started.

How to create the perfect internal status page

Picture this: Your team is scrambling during a system hiccup. Messages fly back and forth, everyone's checking different dashboards, and no one has the full picture. Sounds familiar? That's why more companies use internal status pages as their single source of truth. These private dashboards show you everything that matters.

MTTR guide: how to improve system reliability & response time

Your system just went down. Your team scrambles around frantically while customers flood your inbox with complaints. Each passing minute feels like an eternity — sound familiar? DevOps and SRE teams know this scenario all too well. Meantime to repair (MTTR) directly impacts your customer trust and company reputation. MTTR might seem simple on the surface — measure how long it takes to fix problems. But nailing this metric takes more than just tracking numbers.

Simplify operations across hybrid cloud with OpsRamp

According to IDC, 80% of organizations are running hybrid and multicloud environments, bringing new complexities and risks for IT leaders*. When it comes to operations, IT teams find it challenging to maintain visibility across cloud and on-prem systems, optimize more and more tools, and automate operations—all while ensuring cost efficiency and staying agile. Traditional approaches complicate things further, often leading to silos and inefficient resource use.

What is Network Discovery? Everything You Need to Know

Network discovery is the crucial first step for any IT team looking to manage a modern, dynamic network. As companies embrace flexible work options and adopt complex hybrid environments, taking stock of all connected devices is essential to maintain performance, ensure security, and enable users to stay productive from anywhere. This article will cover everything you need to know about network discovery, from its core purpose to how it works to the tools that make it happen.

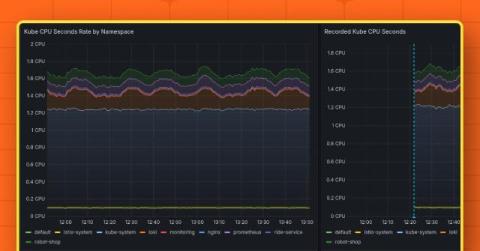
Grafana Alerting: Save time and effort with Grafana-managed recording rules

Grafana Alerting has seen steady growth and adoption since it was revamped in Grafana 9. Since then, we’ve been busy making your alerts more robust, more reliable, and easier to manage. As part of that process, Grafana Alerting has adopted several concepts from Prometheus. The Prometheus alerting model is well understood and flexible, and with Grafana Alerting we want to bring that same flexibility to all Grafana data sources.

Introducing Datadog's Next-Generation Rust-based Lambda Extension

In 2021, we announced the release of the Datadog Lambda extension, a simplified, cost-effective way for customers to collect monitoring data from their AWS Lambda functions. This extension was a specialized build of our main Datadog Agent designed to monitor Lambda executions.