Operations | Monitoring | ITSM | DevOps | Cloud

Latest News

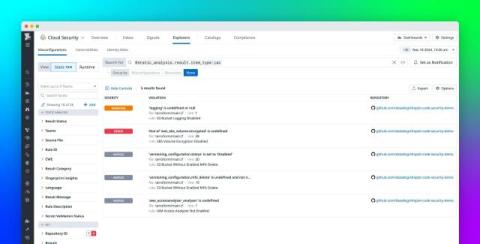
Secure your cloud environment from end to end with Datadog Infrastructure-as-Code Security

Infrastructure-as-code (IaC) tools like Terraform and CloudFormation allow teams to define, manage, and provision their cloud infrastructure using code, as opposed to clicking through consoles or executing commands via a CLI. IaC adoption is now widespread and helps teams increase productivity and efficiency, but it also introduces new surface area for mistakes, defects, and other risks.

How to Fix "Upstream Connect Error" in 7 Different Contexts

The error "upstream connect error or disconnect/reset before headers. reset reason: connection failure" has become a challenge for DevOps teams. This critical error, occurring when services fail to establish or maintain connections with their upstream dependencies, can significantly impact system reliability and user experience.

Prometheus Blackbox Exporter vs Kuberhealthy for K8s monitoring

We all implement tools to monitor our nodes and keep our entire cluster up and running. But how often do updates, failures, or errors mean that users suffer outages, even though our status boards look green? As Kubernetes has enabled more complex microservice architecture, the gap between the state of the dashboard, and the health of services for the user, has grown wider.

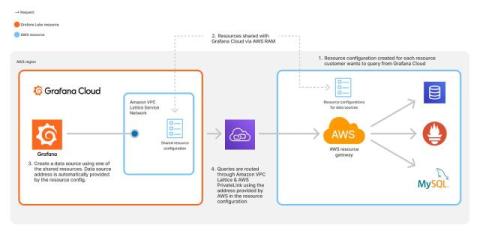
How to query private network data without an agent using AWS and Grafana Cloud

Connecting to data sources in a private network or an Amazon Virtual Private Cloud (Amazon VPC) can require extra attention to the network security configuration to prevent unintended network exposure. For example, if you wanted to query a network-secured data source, like a MySQL database or an Elasticsearch cluster, that is hosted in an on-premises private network, you would need to open your network to inbound queries from a range of IP addresses.

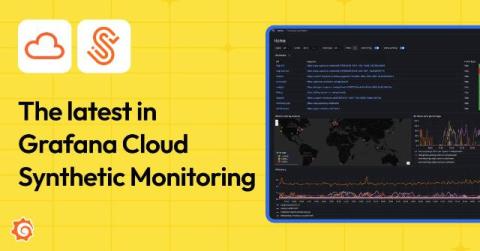
The evolution of Grafana Cloud Synthetic Monitoring: new features, pricing updates, and more

With 2024 coming to a close, it’s a good time to reflect on how Grafana Cloud has evolved this year — and synthetic monitoring, in particular, is one area where we’ve really focused our efforts. In May, we rolled out a revamped version of Grafana Cloud Synthetic Monitoring with the overall goal of making your monitoring processes not just more efficient, but more impactful.

Uptime vs. Availability: What's the Difference and Why It Matters

In June 2019, a curious thing happened. Students were forced to go fully analog, putting pencil to paper when they couldn’t log in to their Google Classroom accounts. Avid media consumers sat staring blankly at buffering YouTube videos. Gmail notifications came to a screeching halt as inboxes sat eerily quiet. It wasn’t that the Google Cloud Platform had crashed — far from it.

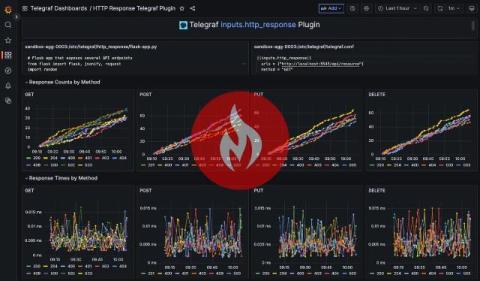
Easiest Way to Monitor Your API Endpoints Using Telegraf

Monitoring the health of your API endpoints is crucial to keeping your applications running smoothly and ensuring users have a reliable experience. Keeping an eye on 4XX and 5XX status codes can help you spot issues like client errors, misconfigurations, or server problems before they get out of hand. Plus, setting up alerts for when these errors spike allows you to react quickly, fix problems, and maintain a high-quality service that your users can count on.

The Leading SNMP Monitoring Tools

SNMP, which stands for Simple Network Management Protocol, is often viewed as a legacy protocol, with SNMP not being actively worked on anymore, which led to both Microsoft and Google pronouncing that SNMP was dead. Yet, SNMP is still commonly used by numerous industries as the advantages of SNMP, especially for network monitoring, are profound. Practically, all network components across all vendors possess built-in SNMP capability.