Operations | Monitoring | ITSM | DevOps | Cloud
Latest News
Three Key Takeaways from The State of Digital Operations Report 2021
2020 heralded a year of increased complexity and customer demands, which isn’t going away. In this new normal, organizations will still be tasked with keeping up this break-neck pace. So, what did digital operations look like in 2020 compared to 2019?
7 Ways Your Status Page Can Save You
Having a Status Page is like having a dog. A dog alerts you to an incident; sudden noise, approaching neighbor, squirrel… A dog sounds the alarm on an intruder. A dog even alerts you to maintenance by barking at every handyman, garbage truck, and gardener within sight. As a dog fetches the same stick over and over, so does a status page fetch the attention of your users – especially during a live incident – with each browser refresh they wait for the status to change.
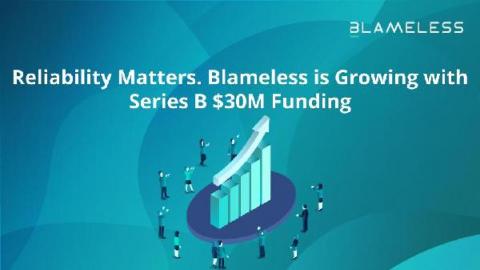
Reliability Matters. Blameless is Growing with Series B $30M Funding
What's New: Introducing Next-Gen ChatOps With PagerDuty and Slack
In this new world of digital everything, new application versions usually mean that you’re going to get bigger and better features, more capabilities, and an uplifted user experience, right? When I talk to customers, many can’t wait to upgrade the PagerDuty integrations that they depend on to test new features. If you’re a PagerDuty for Slack user, the next-generation version of our Slack integration will certainly be an exciting development.
Getting over on-call anxiety
You've joined a company, or worked there a little while, and you've just now realised that you'll have to do on-call. You feel like you don't know much about how everything fits together, how are you supposed to fix it at 2am when you get paged? So you're a little nervous. Understandable. Here are a few tips to help you become less nervous.
Experiencing Turbulence? Hypercare Helps Travel and Hospitality Firms Manage Sky-High Demand
Many sectors suffered during the COVID-19 pandemic, but the travel and hospitality industry was struck particularly hard as the world went into lockdown and governments urged us to stay home. According to the International Air Transport Association, global air passenger demand in 2020 was down a record 65.9% from the previous year, and the tourism industry saw an estimated loss of 100.8 million jobs worldwide.
How to Reduce Alert Fatigue: Preventing Noisy Alerts and Error Messages
Monitoring solutions are a vital component in managing an application’s environment. From the systems layer all the way up to the end user’s connection to the app, you want to find out how the platform is performing. Indicators like CPU, memory, the number of connections, and overall health help teams make informed decisions for guaranteeing uptime. Teams monitor metrics (short-term information) and logs (long-term information) mainly from a reactive perspective.
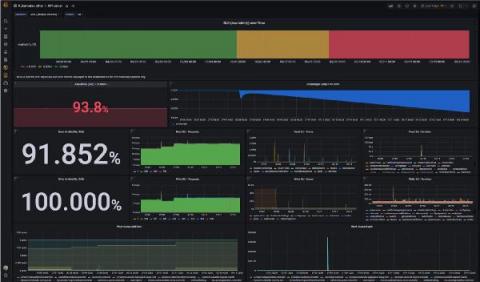
How Grafana helps organizations manage SLOs across multiple monitoring data sources
“SLO is a favorite word of SREs,” Grafana Labs Principal Software Engineer Björn “Beorn” Rabenstein said during his talk at KubeCon + CloudNativeCon NA 2019. “Of course, it’s also great for design decisions, to set the right goals, and to set alerting in the right way. It’s everything that is good.” So what happens when things go bad?


