To get visibility into highly distributed applications, organizations often use various tracing tools that are best suited to each individual service owner’s specifications. However, when a request travels between services that have been instrumented with different tools, the trace data may be formatted differently, resulting in broken traces.
In part 1 of this post, we talked about how Cribl is empowering security functions by giving our customers freedom of choice and control over their data. This post focuses on their experiences and the benefits they are getting from our suite of products. In a past life, I was in charge of security and operational logging at Transunion — around 2015, things started going crazy.
The unexpected collapse of Silicon Valley Bank (SVB) in March served as a wake-up call for financial institutions, depositors, shareholders, and regulators alike. If a seemingly-solid bank like SVB can go under almost overnight, everyone has begun to wonder if any financial institution is safe, with banks and regulators worldwide analyzing the continued risk to the entire banking system.
How often have you heard the phrase “trust is earned” in life? While well-meaning, I think this can actually lead to some strange behaviour at work, especially when you’re on a fast growing team. Startups experience a lot of chaos and unknowns your teams need to navigate, so it’s vital to know you can trust the people around you. As you grow, how you set expectations around trust as people join your team can impact your ability to hire, onboard, ship and ultimately, survive.
Users are complaining about slow load times and you’ve thrown logs, traces, and metrics — heck, the entire kitchen sink of performance monitoring — at your application, but you still can’t figure out the source of the bottleneck. Maybe you missed adding instrumentation to something in the critical path, or you’re simply testing in an environment vastly different from the ones your users are experiencing in production.
Elasticsearch is used for a wide variety of data types — one of these is metrics. With the introduction of Metricbeat many years ago and later our APM Agents, the metric use case has become more popular. Over the years, Elasticsearch has made many improvements on how to handle things like metrics aggregations and sparse documents. At the same time, TSVB visualizations were introduced to make visualizing metrics easier.
BugSplat's new auto-grouping feature is a powerful way to automatically group crashes in a way that's meaningful to your team. Normally, crashes are grouped by the top of the call stack. But sometimes this grouping isn't ideal. For example, if the top of your call stack is KERNELBASE!RaiseException (a Windows OS function) you'd probably prefer the crashes were grouped by a different stack frame. That's what BugSplat's auto-grouping feature does!
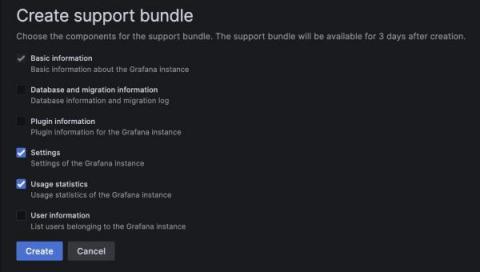
With the arrival of Grafana 9.5, we’re excited to introduce Grafana support bundles — a tool to help debug your Grafana instance faster and more easily. Support bundles provide a simple way to gather and share information about your Grafana instance, and this feature is available across all tiers in Grafana Cloud as well as in Grafana OSS and Grafana Enterprise.