Today we’re announcing the general availability of the Icinga Cube in version 1.3.0. You can find all issues related to this release on our Roadmap.
Over time, Kubernetes has become a household name for container orchestration as organizations aim to streamline complex processes. With its rapidly growing popularity and convenient ecosystem, many organizations started using it to manage their applications and workloads. But what exactly is it, and how did it come into existence?
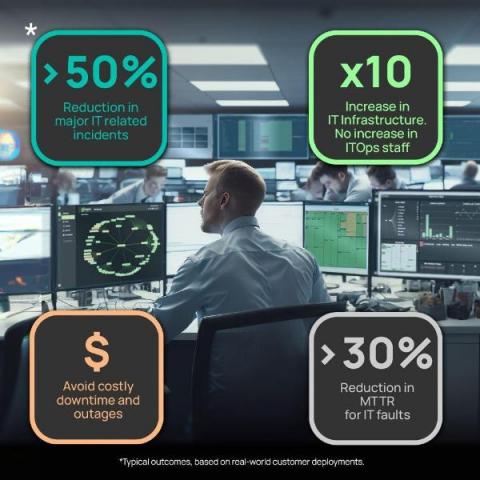
Maintaining trust in the business services your customers rely on is everything. With ever-increasing customer expectations and the promise of ‘always-on’ services, poor digital experiences and outages can cause significant harm to your business. The Interlink Software AIOps and Observability platform strengthens IT teams’ capability to deliver more reliable, available digital services and reduce the risk of customer impacting disruption.
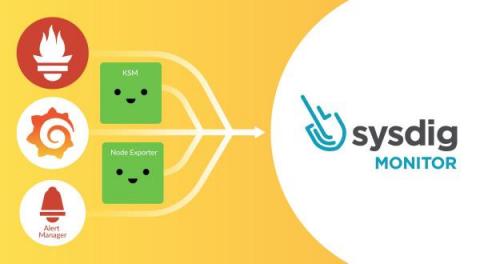
Are you an OSS Prometheus, Grafana, and Alert Manager user thinking about migrating to Sysdig Monitor, and don’t know about the transition details? Are you wondering what the benefits are of using Sysdig Monitor instead of DIY Prometheus, Grafana, and Alert Manager? If so, then this article is for you!
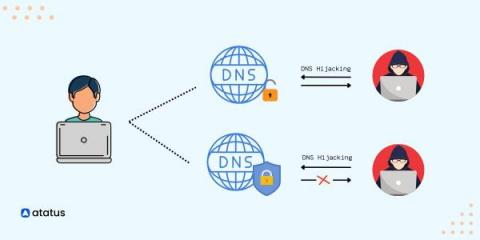
Have you ever wondered how the internet manages to translate the domain names you type into the browser into IP addresses that connect you to your desired websites? The answer lies in the Domain Name System (DNS), a complex network of servers and protocols that makes online communication possible. But with this complexity comes the need for DNS monitoring, which plays a crucial role in ensuring website availability, preventing security breaches, and optimizing network performance.
We’re at a unique moment in business history. Organizations face mounting pressure to streamline their processes and improve productivity and performance, often with tighter budgets and fewer resources. Business leaders must drive uninterrupted innovation and enable their teams to do great work—despite economic uncertainty. My team and I are passionate about developing innovative solutions to customers’ pressing needs.
Migrating an on-prem database to a public cloud comes with a number of benefits, such as no longer needing to manage and maintain physical infrastructure, dynamic scaling, disaster recovery, and overall cost reduction. However, migrating to the cloud can often be a complex and daunting task. For instance, if an organization is a Microsoft shop with teams that rely on SQL Server databases, Azure is a natural fit for its needs.
Given the endless choices customers today have, offering excellent customer service is the only way to stay relevant in a cut-throat CX landscape. 73% of customers say that customer experience is a determining factor when making purchases, while 42% are ready to pay more in exchange for superior customer service. However, delivering instant and personalized customer experiences at scale across channels is a challenging feat today.
I want to make my microservices more observable. Currently, I only have logs. I’ll add metrics soon, but I’m not really sure if there is a set path you follow. Is there a beginner's guide to observability of some sort, or best practice, like you have to have x kinds of metrics? I just want to know what all possibilities are out there. I am very new to this space.