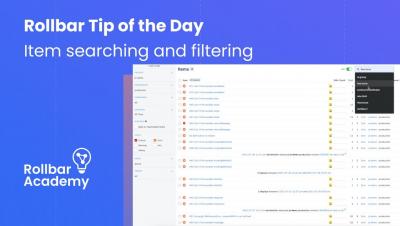
Operations | Monitoring | ITSM | DevOps | Cloud

Latest Videos

Sumo Logic Kubernetes Webinar

Maximize your Kubernetes management by using the Data Explorer, which offers a service-oriented view of your cluster and allows you to seamlessly correlate logs and metrics as you accelerate your workflow. In this session, Sumo Logic Solutions Engineer, Dan Reichert, discusses how to navigate your Kubernetes environment and understand exactly what you should be monitoring across all workflows.

Resource Management, Images, and more with ServiceDesk Plus 11.1

The user education team at ServiceDesk Plus brings you a close-up on all the great features built into ServiceDesk Plus 11.1. Learn how resource management helps you distribute tasks among your techs; add images to your service templates; customize your application pages by user, and much more.

How to Quickly Identify Suspicious Network Behavior With Intuitive Dashboards in SolarWinds SEM

Log and event data are a boundless and valuable resource for identifying suspicious network activity and stopping potential breaches. However, analyzing lines and lines of text-based data can make this resource more trouble than it's worth. In this video, we'll explore the different ways you can customize log data in an easy-to-understand and visual dashboard in Security Event Manager to help turn it into something you can act on.

SolarWinds Server Configuration Monitor Overview

SolarWinds Server Configuration Monitor (SCM) is designed to provide insights into Windows® server and application changes to help you pinpoint the root cause of performance problems faster. Detect, track, and receive alerts when changes occur, allowing you to correlate system performance against configuration changes, know who made changes, and compare configurations over time. SCM integrates with SolarWinds Server & Application Monitor, allowing you to extend troubleshooting of system and application performance from one unified console.