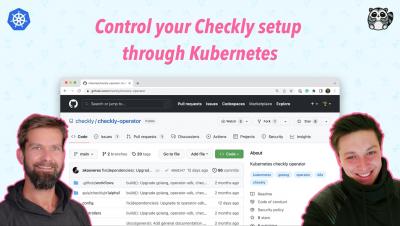
"I'm now a YAML engineer!" | How to control Checkly from within Kubernetes
Join Stefan Judis and Ákos Veres to learn how to use the new Checkly Operator and control your Checkly monitoring via Kubernetes.


The latest News and Information on Monitoring for Websites, Applications, APIs, Infrastructure, and other technologies.
If you’re writing software today, then you likely use a CI/CD pipeline to build and test your code before deploying it to production. Having a fast and efficient build pipeline saves you development time, shortens feedback loops, and helps you ship features faster. Conversely, slow and unreliable build pipelines are full of lost productivity and sadness.
A big piece of news to come out of ObservabilityCON in early November was the launch of Grafana Phlare. Phlare is an open source, horizontally scalable, highly available, multi-tenant continuous profiling aggregation system. Continuous profiling has been dubbed the fourth pillar of observability, after metrics, logs, and traces. The idea behind Phlare was sparked during a company-wide hackathon at Grafana Labs.
The moment has finally arrived! “Yes! I do” “Yes! I do” With great joy, I now introduce to you the newly married Edge and AppScope! Beginning the journey of a lifetime, let’s give it up for this power couple! Together they offer auto-discovery, central management, high scalability, high-fidelity data collection, and rich observability.
I joined Checkly a few months ago, and because our platform enables you to use Microsoft’s Playwright to run your synthetic monitoring, I started getting my hands dirty with the end-to-end testing framework. I’m a massive fan of learning in public, so I started publishing weekly Playwright tips on YouTube. Did you miss a few videos? Don’t sweat it! Here’s the first collection of Playwright tricks I discovered over the last few months.
JavaScript is one of the most widely used programming languages for creating dynamic, interactive websites. However, there may be instances where a function is not operating as intended because of a coding error while creating JavaScript projects. Therefore, the majority of developers hunt for JavaScript debugging tools to avoid problems and identify errors before execution.
Healthchecks.io recently got a new feature: run IDs. Run IDs are client-chosen UUID values that the client can optionally add as a “rid” query parameter to any ping URL (success, /start, /fail, /log, /{exitcode}). What are run IDs useful for? Healthchecks.io uses them to group events from a single “run”, and calculate correct run durations. This is most important in cases where multiple instances of the same job can run simultaneously, and partially or fully overlap.
A three-part guide to assuring performance and availability of critical cloud services across public and hybrid clouds and the internet.