The latest News and Information on Monitoring for Websites, Applications, APIs, Infrastructure, and other technologies.
Elastic has an entirely new Heartbeat/Synthetics workflow superior to the current workflow. If you’re a current user of the Elastic Uptime app, read on to learn about the improved workflow you can use today and should eventually migrate toward.
Modern computing environments and distributed workforces have produced new challenges to traditional information security approaches. Many traditional threat detection and response strategies rely on homogeneous environments, system baselines, and consistent control implementations. These strategies have been built on traditional environment assumptions that may no longer be true in your environment with the evolution of cloud computing, remote work, and modern culture.
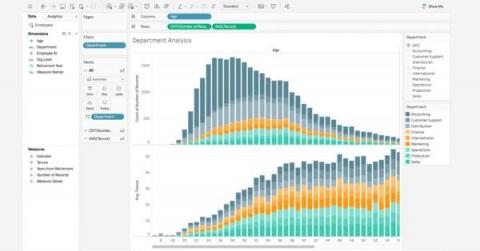
A look at best practices, no-code and low-code platforms you can use, common visualization types, criteria for good data visualization and more. Organizations regularly generate an overabundance of data that is essential for decision-making. Data visualizations play an important role in helping people understand complex data and observe patterns and trends over a period of time.
Earlier this month, we announced a rebrand to meshIQ and in this blog we will highlight the reasons behind the rebrand and what you can expect going forward.
Get a guided tour on advanced Oracle monitoring based on Microsoft System Center Operations Manager.
In the blog titled “Streamline Endpoint Data with Cribl Pack for SentinelOne Cloud Funnel” we dove into the Cloud Funnel data, its relevance in the modern SOC, and how Cribl Stream transforms the data while addressing visibility gaps. We left the AWS-specific details to this blog for those not yet familiar with configuring AWS S3 buckets, SQS Queues, and Identity and Access Management (IAM).
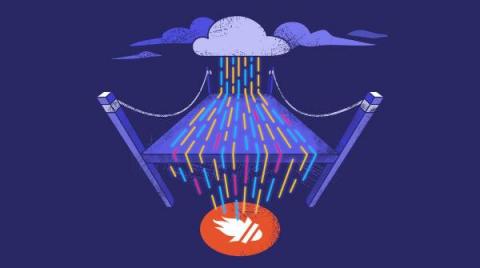
Cloudwatch is the de facto method of consuming logs and metrics from your AWS infrastructure. The problem is, it is not the de facto method of capturing metrics for your applications. This creates two places where observability is stored, and can make it difficult to understand the true state of your system. That’s why it has become common to unify all data into one place, and Prometheus offers an open-source, vendor-agnostic solution to that problem.
As an open source company that grew out of a side project in 2008 to an application and performance monitoring platform (APM) used by over 3.5 million developers, Sentry is committed to open source and the community of developers maintaining and building in the open. Similarly, we take a public approach to building our software, which is why it’s a natural extension of our values to announce our support for OpenTelemetry (or OTel), the leading open standard for observability.