Operations | Monitoring | ITSM | DevOps | Cloud

Monitoring

The latest News and Information on Monitoring for Websites, Applications, APIs, Infrastructure, and other technologies.

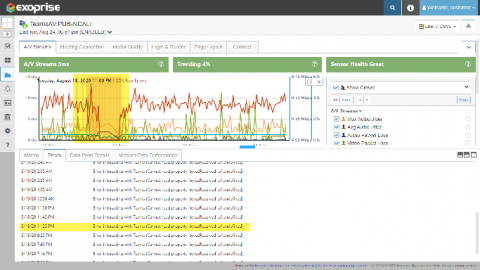
Early Teams Outage Detection & Analysis - August 19-20 2020

Unfortunately, in this time of increased dependency on Microsoft Teams, Zoom and other remote conferencing solutions while working from home, Microsoft 365 had a Teams Audio/Video Conferencing outage between August 19th and 20th of this year. Fortunately, for Exoprise customers, they were able to detect the outage, learned of it many hours before Microsoft reported the outage and were able to stay informed as to when it was fixed.

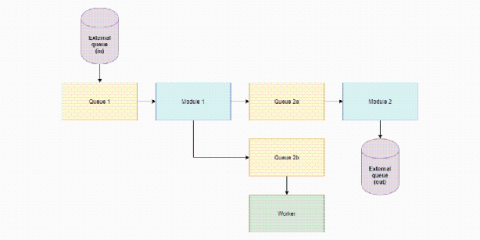
How we scale Raygun's architecture to handle more data

Due to the huge importance of sourcemaps in the workflow of our customers, sourcemaps are a crucial part of our Crash Reporting offering. We constantly strive to stay ahead of our customer demands as the amount of data we process continues to grow. We identified the sourcemapping process as an area ripe for performance improvement, so we took it apart and looked at exciting ways to build it from the ground-up using cutting-edge tech.

How to Monitor Your Kubernetes Cluster: Prometheus vs Datadog

So you’ve got a shiny new Kubernetes cluster up and it’s a dream. Deploying code is easy, scaling is a breeze, and you’ve never felt so efficient. However, despite claims that Kubernetes is self-healing, there’s still a nagging feeling in the back of your mind that wants to make sure your cluster is running smoothly. Just like any other tool, you need a monitoring solution to give you insight into Kubernetes.

Filter Company Allowed 3.4 Million Customers to Shop on Hacked Site

Filters Fast knowingly allowed approximately 3.4 Million customers to shop on their compromised website for over 5 months, in a year-long data breach. FiltersFast.com sells a variety of home filtration products. The company is based in North Carolina, USA, and according to SimilarWeb, the company averages approximately 574,190 website visitors each month.

Engineer Intelligent Alerting for Efficient Network Monitoring

Imagine a scenario where your Network Monitoring team has a group of very talented, organized, and focused technicians. Close to half of them are engaged in monitoring the system almost throughout the day. They can take care of the issues and problems as soon as they arise, and you are never facing any downtime. This is an ideal case scenario, right?

Goliath Partners with Automai for App Performance Monitoring

IPhiladelphia, PA and Los Angeles, CA – August 25, 2020 – Goliath Technologies, a leader in end-user experience monitoring and troubleshooting software, and Automai, specialized in application monitoring, today announced their partnership to extend Goliath’s solution to provide visibility into users’ experiences working within applications.

Open Source Grafana Tutorial: Getting Started

Open source grafana is one of the most popular OSS UI for metrics and infrastructure monitoring today. Capable of ingesting metrics from the most popular time series databases, it’s an indispensable tool in modern DevOps. This OSS grafana tutorial will go over installation, configuration, queries, and initial metrics shipping. Open source grafana is the equivalent of what Kibana is for logs (for more, see Grafana vs. Kibana).

How to solve network issues faster than ever with Auvik

Getting to the bottom of a network issue is a race against the clock. But with Auvik, time is on your side. Learn how having network topology, performance metrics, traffic analytics, and centralized logs all in one convenient dashboard can help you dramatically shrink resolution times on network issues and keep your end users connected.

3 tips to improve your Grafana dashboard design

Every Grafana user is a dashboard designer. The Grafana community gladly shares their dashboards, so there’s tons of inspiration available. Chances are you’ve downloaded some community dashboards and tweaked them in search of patterns that work for you. But if you haven’t found them, you’re not alone! In my Aug. 27 webinar, “A beginner’s guide to dashboard design,” I’ll cover the basics of good dashboard design.