Operations | Monitoring | ITSM | DevOps | Cloud
Monitoring
The latest News and Information on Monitoring for Websites, Applications, APIs, Infrastructure, and other technologies.
The concise guide to labels in Loki
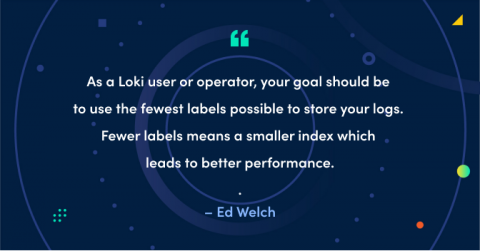
A few months ago, I wrote an in-depth article describing how labels work in Loki. Here, I’m consolidating that information into a more digestible “cheat sheet.” There are some big differences in how Loki works compared to other logging systems which require a different way of thinking. This is my attempt to convey those differences as well as map out our thought process behind them. As a Loki user or operator, your goal should be to use the fewest labels possible to store your logs.
Continuous Improvement in Native
If Sentry were a TV show, I think it would be Lassie. It’s your application’s best friend and everyone can understand it no matter what language they speak. Sentry gets help from the right people to make sure Timmy, I mean your application, is safe and sound. Over the past few months, we improved our Native SDK significantly. Most notably, we increased platform compatibility through a major rewrite from C++ to C and by switching to the CMake build system.
Extended retention for custom and Prometheus metrics in Cloud Monitoring
Metrics help you understand how your business and applications are performing. Longer metric retention enables quarter-over-quarter or year-over-year analysis and reporting, forecasting seasonal trends, retention for compliance, and much more. We recently announced the general availability (GA) of extended metric retention for custom and Prometheus metrics in Cloud Monitoring, increasing retention from 6 weeks to 24 months. Extended retention for custom and Prometheus metrics is enabled by default.
Azure MP part 2: Configuring monitoring
This is part two of our journey towards monitoring Azure resources with SCOM, using the Azure Management pack. In Part 1: Installation, we finished installing the Management Pack and managed to connect one of our subscriptions where the resources we want to monitor are. Now, let’s move on to configuring the monitoring for actual resources or services.
How To Monitor & Troubleshoot Remote Worker User Experiences
[Webinar] Three pillars of observability
[Webinar] Best practices for monitoring the operational health of your servers
[Webinar] Digital end-user experience is everything:10 tips for webmasters
Monitoring your own infrastructure with open-source Graphite and Grafana
An infrastructure, especially if it is scalable, can become extremely complex to visualize and observe. If something goes wrong, it would be difficult to fully understand the problem without a great data monitoring strategy. Information related to CPU, RAM, and statistics about SSH or HTTP servers are critical to understanding the performance of your web-application.


