Operations | Monitoring | ITSM | DevOps | Cloud
Monitoring
The latest News and Information on Monitoring for Websites, Applications, APIs, Infrastructure, and other technologies.
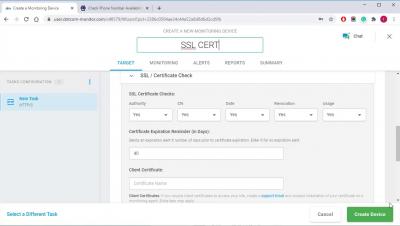
Monitoring SSL Certificates for Expiration
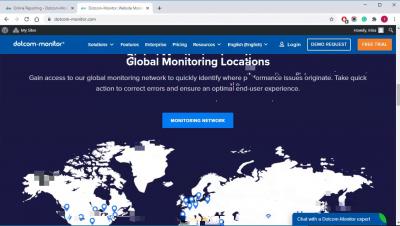
Monitoring Website Performance From China
Infrastructure monitoring with Netdata Cloud
Web Performance Profiling: Nike.com
Google has long used website performance as a ranking criteria for search results. Despite the importance of page experience for SEO, many sites still suffer unacceptable load times. Poor performance is often a confluence of factors: slow time to first byte, hundreds of resource requests, and way too much JavaScript.
How to Fix Common Errors for Beginners in InfluxDB Cloud 2.0
In this post, we’ll review some common InfluxDB Cloud 2.0 errors for beginners. We’ll discuss probable causes as well as recommended fixes. This blog uses the Telegraf System Configuration and data as an example to illustrate the various errors you may encounter. Having some familiarity with this dataset is useful in understanding the issue and the resolution.
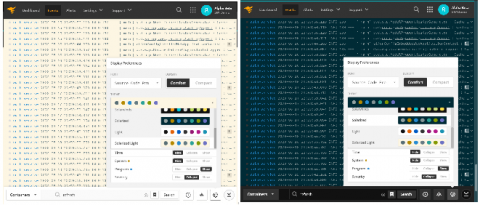
Two New Color Themes in the Event Viewer Display Options
Release Update - Gullfoss
In today’s Tip of the Day, we will be looking at some of the highlights in our new release: Gullfoss. Named after the spectacular 32 meters waterfall in Iceland, our latest release is no less impressive. All the Catchpoint releases in 2020 have focused on the GUI, workflows, and getting you the answers you need in as few clicks as possible.
Get on the Right Track with Our Rails Integration!
Thanks to awesome contributions from the community and the hard work of our integrations team, the Honeycomb Rails integration comes with lots of great features out of the box. This post is an end-to-end tutorial to show you exactly the steps involved, from creating a new Honeycomb team to getting your data in and observing your app in production.
Alerting and anomaly detection for uptime and reliability
Being able to easily monitor the health of all your sites and services from multiple global locations is a powerful tool for site reliability. However, no one wants to sit and stare at a status dashboard all day. Naturally, teams want to be alerted when there is an issue. We can do that with alerting in Kibana. And when coupled with Elastic machine learning, alerts can be automatically generated from anomalies that are automatically detected. That’s the power of Elastic Observability.


