Operations | Monitoring | ITSM | DevOps | Cloud

Monitoring

The latest News and Information on Monitoring for Websites, Applications, APIs, Infrastructure, and other technologies.

The Magnificent Seven: New Ways to Get More Out of Your Microsoft and Splunk Environment

As a leading global provider of cloud computing services with a business critical software portfolio, Microsoft is a key Splunk partner. In our mission to empower customers with data, we are delighted to share a few of the latest integrations, dashboards, and reference guides that help you extract even more value from your Microsoft environments. Here’s a peek at what we’ve been working on lately.

Running Elasticsearch, Logstash, and Kibana on Kubernetes with Helm

Kubernetes (or “K8s”) is an open-source container orchestration tool developed by Google. In this tutorial, we will be leveraging the power of Kubernetes to look at how we can overcome some of the operational challenges of working with the Elastic Stack.

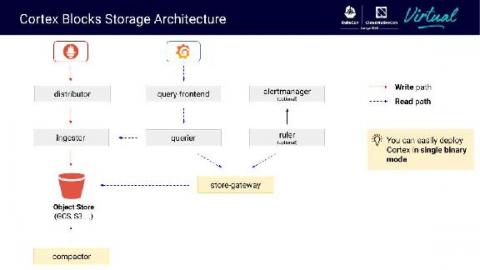
[KubeCon + CloudNativeCon EU recap] Getting some Thanos into Cortex while scaling Prometheus

Yesterday at KubeCon + CloudNativeCon EU, Grafana Labs software engineer Marco Pracucci, a Cortex and Thanos maintainer, teamed up with Thor Hansen, a software engineer at Hashicorp, to give a presentation called “Scaling Prometheus: How we got some Thanos into Cortex.” In their talk, the pair discussed a new storage engine they have built into Cortex, how it can reduce the Cortex operational cost without compromising scalability and performance, and lessons learned from running Cortex at s

Splunk Redefines Application Performance Monitoring with SignalFx Microservices APM

Splunk has a new Application Performance Monitoring solution purpose-built for monitoring and observability in today’s app-driven world: SignalFx Microservices APM. Learn from Rick Fitz, SVP and GM of IT Markets, and Karthik Rau, Area GM for Application Management, about the new release of SignalFx Microservices APM and how it helps DevOps teams innovate faster, elevate customer experience, and future-proof applications — all while adopting cloud-native technologies and microservices architectures.

What Are Traceroutes? | Obkio

What are Traceroutes and how exactly do they help you troubleshoot network problems? Traceroute is the most popular tool that network engineers use to troubleshoot network problems. It was invented in 1987 and is still highly relevant today. As its name suggests, the main purpose of a traceroute is to trace the IP route from a source to a destination inside an IP network. It shows users the round-trip latency from the source to each of the routers. Traceroute commands are available on almost any host.

Meet the Fastest Forwarder on the Net

I have recently been heads-down working on a large Splunk Cloud PoV (20+ TB / day), and the customer asked if Splunk supported their forwarding technology called Vector. I had never heard of Vector, so I took a note to do further research. I couldn’t find anyone else at Splunk who had seen this technology before, so I embarked on a little research project. What I discovered surprised me—Vector is actually fairly powerful, and cool!

Event in Review: MIT Sloan CIO Digital Learning Series - The Post-Pandemic Workplace and Customer Experience

Since the annual MIT Sloan CIO Symposium had to be canceled this year, MIT made the decision to launch a CIO Digital Learning Series. Episode 3 was broken into two parts, beginning with a fireside chat on the post-pandemic workplace, moderated by Irving Wladawsky-Berger with Catchpoint’s CEO Mehdi Daoudi and Eash Sundaram, Executive Vice President, Chief Digital and Technology at JetBlue, which was followed by a panel led by Paul Michelman on customer experience strategies.