Operations | Monitoring | ITSM | DevOps | Cloud
Monitoring
The latest News and Information on Monitoring for Websites, Applications, APIs, Infrastructure, and other technologies.
Introducing the Grafana Accelerator Program, one of the investments we're making in the community after raising $50 million
This morning, we announced that we raised $50 million in Series B funding. This additional funding, following our $24 million round last October, will enable us to dramatically accelerate research and development at Grafana Labs. We plan to hire more engineers and focus on product innovation. And importantly, it will help us continue to nurture and grow our community of millions of developers around the world.
Identifying and Resolving a Kafka Issue With AppSignal
Last week, we had an issue with one of our Kafka brokers. Don’t worry, it didn’t impact any customers. When monitoring things closely, you can often solve things before they impact a customer ;-). In today’s post, I’ll show you how we use AppSignal to dogfood our own issues. I’ll go through how we monitor the non-Ruby part of our stack and how we used AppSignal to detect and resolve the issue.
Datadog Marketplace
Understanding Database Transactions in Rails
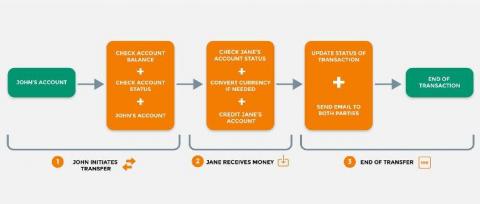
Few things are scarier than a database slowly losing integrity over weeks or years. For a while, nobody notices anything. Then users start reporting bugs, yet you can't find any code that's broken. By the time you realize the problem, it may be happening for so long that your backups are unusable. We can avoid problems like these with skillful use of transactions.
Cutting Right to the Business-Critical Problems at the Heart of Your Operations
Let’s talk about SAP: One of the most important, defining factors of your business’ success, and one of the biggest risks to business health when its processes go south. Surely there’s an easier way to monitor it?
AppDynamics Releases Next Generation SAP Performance Management Solution
See how SAP Peak combines deep visibility into your SAP landscape with powerful business context to help you drive smarter and faster decision-making.
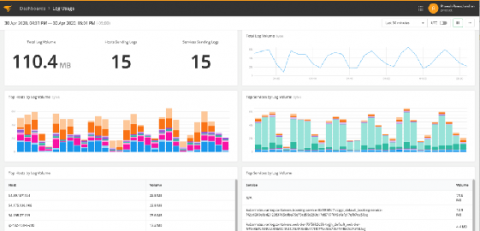
New Volume Reporting and Alerting Feature Announcements
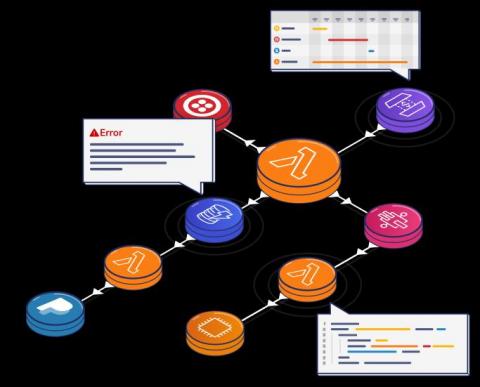
What alerts should you have for serverless applications?
A key metric for measuring how well you handle system outages is the Mean Time To Recovery or MTTR. It’s basically the time it takes you to restore the system to working conditions. The shorter the MTTR, the faster problems are resolved and the less impact your users would experience and hopefully the more likely they will continue to use your product! And the first step to resolve any problem is to know that you have a problem.
How to Select the Best Network Monitoring Tool for Your Needs
When it comes to protecting your company’s important data and network, it doesn’t matter what size your firm is, keeping things safe and running smoothly should be a top priority. For this reason, many invest in network monitoring tools like Pandora FMS. This is because we offer a software solution to make sure your network is always safe and secure around the clock. Let’s learn a bit more about the process of network monitoring and why it’s so important here!


