Operations | Monitoring | ITSM | DevOps | Cloud

Monitoring

The latest News and Information on Monitoring for Websites, Applications, APIs, Infrastructure, and other technologies.

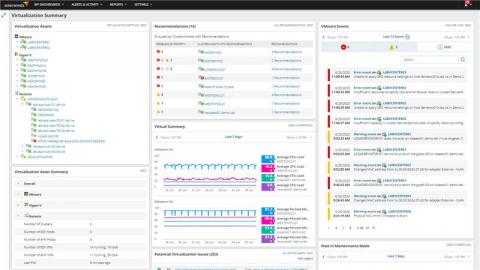
SolarWinds Gives IT Pros New Levels of Hybrid IT Support With Enhanced IT Operations Management Portfolio

Introduces new and improved software-defined solutions support, AWS and Azure workload troubleshooting and visibility, and full-stack application and infrastructure monitoring capabilities

Datadog on RocksDB

Datadog is a monitoring and analytics platform that ingests trillions of data points per day, coming from more than 8,000 customers. Each of those is associated with metadata, mostly in the form of tags, and it can also be part of streams of related data points, which can then be explored, queried, or aggregated. RocksDB is used by many services at Datadog that are part of that metrics ingestion, aggregation, query, and index pipeline.

Monitor, Troubleshoot, and Optimize Your Virtual Environment With SolarWinds Virtualization Manager

SolarWinds® Virtualization Manager (VMAN) is a vendor-agnostic monitoring tool designed to provide alerting and performance recommendations for VMware vSphere®, Microsoft Hyper-V®, Nutanix® AHV, and both Azure® and AWS® IaaS environments. See how Virtualization Manager can help you optimize and tune your virtual environment.

How AppSignal Monitors Their Own Kafka Brokers

Today, we dip our toes into collecting custom metrics with a standalone agent. We’ll be taking our own Kafka brokers and using the StatsD protocol to get the metrics into AppSignal. This post is for those with some experience in using monitoring tools, and who want to take monitoring to every corner of their architecture, or want to add their own metrics to their monitoring setup.

Automating MSP Client Onboarding with LogicMonitor

Automating client onboarding can eliminate the tedious task of cloning dashboards, creating group directory structure, setting up reports, and configuring access roles. All of these tasks are prone to human error and to put it mildly, not really fun to do. In this blog, we’ll walk through a PowerShell script to automate some of these tasks.

How to Manage Datadog Resources Using Terraform | Datadog Tips & Tricks

Terraform allows you to efficiently manage complex infrastructure environments, and Datadog is an important piece of those environments. With the Datadog provider, you can use Terraform to manage your Datadog resources as code, allowing you to create and edit resources with the same tool you’re already using for your infrastructure. This video will show you how to do just that through the example of creating a Datadog monitor.

How to Build A Unified Dashboard | Datadog Tips & Tricks

In this video, you’ll learn how to create unified dashboards to enable your teams with valuable information and performance visualizations from across the Datadog platform. Dashboards allow your teams to see all data from across the Datadog platform side-by-side, enabling holistic visibility and breaking down silos between Dev and Ops teams. In this video, you’ll learn how to create a Screenboard, showcasing data such as frontend system latency, backend system latency, and Service Level Objectives all in one place.

Identifying Environment Right Sizing Opportunities for Cost Efficiency | Datadog Tips & Tricks

In this video, you’ll learn how to use the host map to identify opportunities to rightsize your environment to become more cost efficient. MoneySuperMarket Group was able to cut their cloud infrastructure costs by over 50% by utilizing Datadog. This video unpacks some of the practices used by MoneySuperMarket’s engineering team to accomplish that.