Operations | Monitoring | ITSM | DevOps | Cloud

Monitoring

The latest News and Information on Monitoring for Websites, Applications, APIs, Infrastructure, and other technologies.

Test on-premise applications with Datadog Synthetic private locations

Synthetic monitoring lets you improve end user experience by proactively verifying that they can complete important transactions and access key endpoints. But your applications serve many users, from customers to all the employees who run your business. This makes testing the performance of any internal-facing services within your private network just as critical as monitoring your external-facing applications.

New free Ping Tool. Ping from multiple locations all at once.

Ping is a network tool. The tool seeks out a given address over a network to check if one networked device can communicate with another device. The tool then reports on the quality of the connection based on data loss and response times. Uptrends’ new Ping Tool conducts ping tests from multiple worldwide locations at the same time. You can instantly spot localized downtime and latency issues from around the world using one simple tool.

How Nutanix has changed the approach to virtual infrastructure monitoring

Reinventing any technology is an interminable process. When it comes to legacy infrastructure and virtualization, Nutanix took the giant leap to hyper-converged infrastructure (HCI). Dating back to 2009, Nutanix brought in HCI with the vision to invent a better way to build and manage data centers.

Grafana and NGINX are partnering to give the open source community a turnkey experience for visibility

Over the past few years, NGINX users have naturally gravitated toward Grafana, and vice versa. These days, it’s not uncommon to see these two open source tools used together in the wild. And for good reason. F5, which acquired NGINX last year, is prioritizing building visibility across the entire product set, to make it easy for customers to quickly gain the insights that they need. Meanwhile, Grafana has evolved into the primary visualization and analysis tool in the open source market.

Scaling Queue Workers Efficiently with AppSignal Metrics

Most web apps can benefit from a background queue, often used to process error-prone or time-consuming side jobs. These background jobs can vary from sending emails, to updating caches, to performing core business logic. As any background queueing system scales the number of jobs it needs to process, the pool of workers processing those jobs needs to scale as well.

How to Use the Datadog CLI on Kubernetes | Datadog Tips & Tricks

In this video, you’ll learn how to use the Datadog command line interface (CLI) on Kubernetes to perform key tasks, including checking the status of the agent and viewing custom checks. The Datadog Agent CLI allows you to check the status of the Agents running on the pods in your Kubernetes clusters. It also provides various helpful commands, including starting and stopping the agent, viewing configured custom checks, and sending flares to the Datadog support team to automatically open troubleshooting tickets.

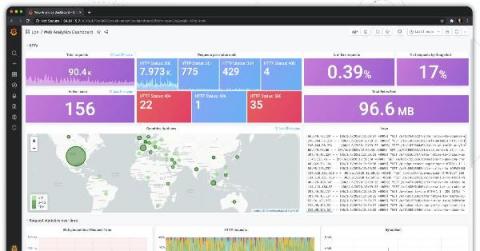
Grafana Loki sneak peek: Generate Ad-hoc metrics from your NGINX Logs

Get a sneak preview of a future version of Grafana Loki that enables you to generate ad-hoc metrics from your log data. This video features a Loki-based web analytics dashboard, which uses the access logs of the popular open-source web server NGINX. Every panel on this dashboard uses ad-hoc metrics created with Loki, well, besides the Log panel obviously. Would this be useful for your use-case? Let us know in the comments.

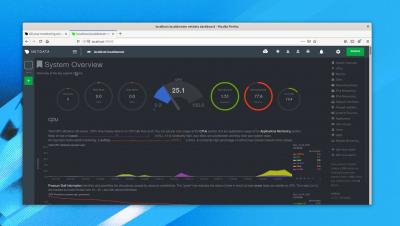
Install Netdata on Linux in two minutes

We've tried really hard to make Netdata's open-source monitoring and troubleshooting Agent as simple and hassle-free as possible. This includes installation, which involves a single command, a few minutes of your time, and zero configuration. Once you've installed Netdata, you'll have access to thousands of metrics on hundreds of interactive charts that update every second, with zero configuration required. It'll even auto-detect your favorite services, like an Nginx web server or MySQL database, and collect metrics from those.