Operations | Monitoring | ITSM | DevOps | Cloud

Monitoring

The latest News and Information on Monitoring for Websites, Applications, APIs, Infrastructure, and other technologies.

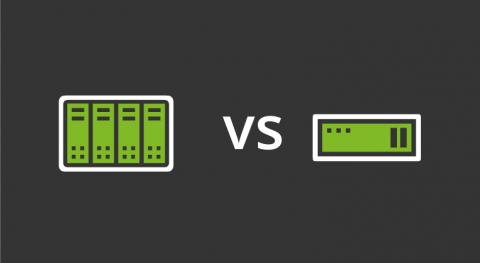
Blade servers vs rack servers. Fight!

Choosing between blade servers or those intended to go installed in a rack is a small headache that is repeated daily in the complex minds of technicians around the world. What configuration to choose? What can best serve my installation? These are questions that are repeated while they pull out their silvery and silky hairs.

How to easily correlate logs and APM traces for better observability

Application performance monitoring (APM) and logging both provide critical insight into your ecosystem. When paired together with context, they can provide vital clues on how to resolve problems with your applications. As the log data you analyze becomes more complex, navigating to the relevant pieces can be tricky using traditional tools. With Elastic Observability (powered by the Elastic Stack), correlating logs with APM is as simple as a few clicks in Kibana.

What is Code Profiling? Learn the 3 Types of Code Profilers

At Stackify, we’re all about helping you improve your application’s performance. We have actually developed two code profilers ourselves. Because of that, we like to think we know a thing or two about code profiling. Today I want to talk about the three different types of code profilers, describe the differences between them, and recommend some tools for your toolbox.

When Incidents are not investigated, Problems await

Incident and Problem Management are two very different issues in IT service management that are unfortunately often used interchangeably. On the surface, it might just seem like a matter of terminology. But, what if you get to know that one is a small hiccup and the other could dent your entire quarterly or annual results?

Service and process monitoring: At a glance

With Site24x7 Server Monitoring, you can track the availability and system-level metrics of your servers, including CPU, memory, disk usage, and more. But did you know that you can also monitor the performance of each and every service and process running on your servers? Don't fall behind Almost all applications rely on a large number of services (for Windows) and processes (for Linux) to run smoothly and effectively.

Kafka monitoring: Metrics that matter

Kafka is a distributed streaming platform that acts as a publish-subscribe messaging queue by receiving data from various source systems and making it available to various systems and applications in real time. Key advantages for utilizing Kafka are that it provides durable storage, meaning the data stored within it cannot be easily tampered with, and it is highly scalable, so it can handle a large increase in users, workloads, and transactions when necessary.

Speed up ticket resolution in your ServiceDesk Plus help desk with automation

Helping businesses deliver a seamless customer experience and ensure zero downtime has always been a key aspect of ManageEngine ServiceDesk Plus. One of this service desk solution’s powerful integrations is with Site24x7, wherein tickets are logged for specific Site24x7 alerts like Trouble, Critical, and Down. Once the incidents are resolved in Site24x7, their associated tickets are automatically closed in ServiceDesk Plus.

Speeding up Rails with Memoization

Whoever first said that "the fastest code is no code" must have really liked memoization. After all, memoization speeds up your application by running less code. In this article, Jonathan Miles introduces us to memoization. We'll learn when to use it, how to implement it in Ruby, and how to avoid common pitfalls. Buckle up!