Cannot connect to a website in Vietnam? Try these steps if your website is not accessible.
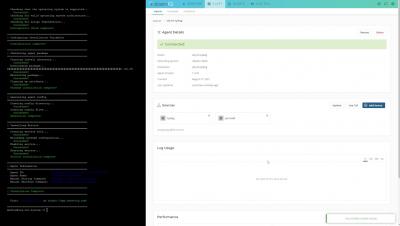
On September 4, 2021 a major submarine cable broke down in Vietnam causing network connectivity issues for a large portion of the population. Organizations hosted online and those with data centers outside those perimeters were hit the worst with most of their applications down or running extremely slow.