Operations | Monitoring | ITSM | DevOps | Cloud

Monitoring

The latest News and Information on Monitoring for Websites, Applications, APIs, Infrastructure, and other technologies.

3 ITSM Strategies to Help your Remote Workforce Thrive

Remote workforces are becoming the new normal. What could be achieved earlier with a simple visit to your colleague’s desk will now require you to communicate flawlessly across miles. ITSM tools that were earlier used only when systems had issues are now being used to make delivery of different business services easier. Quite naturally, not all organizations are prepared for this ‘new normal’.

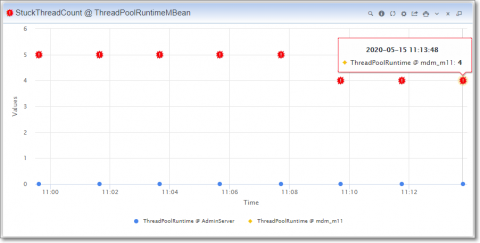
Analyze Stuck And Hogging Threads

What is Stuck Thread? A Stuck Thread is a thread which is processing a request for more than maximum time that you configured in admin console. By Default, the WebLogic server comes with 600 secs. If some thread doesn’t return in 600 secs, It gets a flag ‘stuck thread’. How to deal with Stuck Thread? Take thread dumps instantly. Open thread dumps in visualVM. Analyze dashboard from WebLogic console (managed server > monitoring > threads).

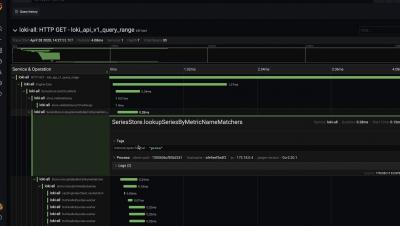
GrafanaCONline Day 2 recap: The future of worldPing and an industrial IoT use case of Grafana

GrafanaCONline is live! We hope you’re able to catch the great online sessions we have planned over the next couple of weeks. After Grafana creator Torkel Ödegaard, Grafana Labs CEO Raj Dutt, and VP of Product (and Cortex co-creator) Tom Wilkie kicked off the conference with a keynote discussing the future of Grafana and the upcoming Grafana 7.0 release, GrafanaCONline continued with a focus on Grafana’s global reach.

How to Trigger Alerts From Application Events

EventSources, the sister LogicModule to DataSources, are a useful framework for triggering event-based, contextual alerts from your applications and infrastructure. While DataSources poll your applications and infrastructure for time-series datapoints, EventSources poll (or listen) for interesting events from your log files, SNMP traps, syslogs, Windows Event Logs, and much more.

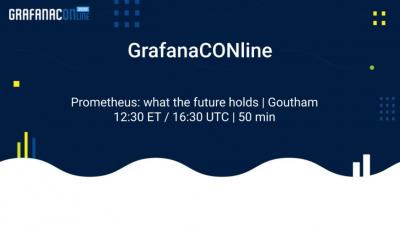
GrafanaCONline: Prometheus: what the future holds

It’s been nearly 2.5 years since Prometheus 2.0 released and 2 years since Prometheus graduated in the CNCF. You might say that clearly proves that Prometheus has become mainstream. However, that doesn’t mean Prometheus would be “done” now. The developer community is more active than ever. Let’s have a look at the highlights of the past year and at the things on the roadmap. The speaker is one of the Prometheus developers and would also be delighted to hear from you what you want to see next in Prometheus.

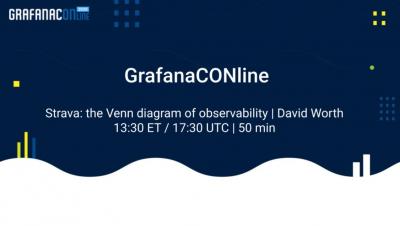
GrafanaCONline: Strava: the Venn diagram of observability

In the era of services architecture, reliability engineering, and container orchestration, the word “observability” is widely used but rarely clearly defined. What is “observability” really? Of the various observability concepts and tools, what are the distinctions and overlaps in various technologies?