Operations | Monitoring | ITSM | DevOps | Cloud

Monitoring

The latest News and Information on Monitoring for Websites, Applications, APIs, Infrastructure, and other technologies.

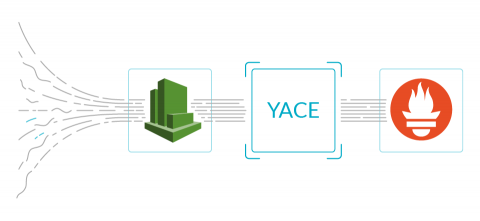
Improving the Prometheus exporter for Amazon CloudWatch

A Prometheus CloudWatch exporter is a key element for anyone wanting to monitor AWS CloudWatch. Exporting CloudWatch metrics to a Prometheus server allows leveraging of the power of PromQL queries, integrating AWS metrics with those from other applications or cloud providers, and creating advanced dashboards for digging down into problems. But, who watches the watcher? Despite those advantages, using the wrong exporter or an incorrect configuration can have bad consequences in production environments.

Tips from the field: Managing costs in Azure

If you’re reading this article, chances are you’re about to start moving into Azure and want to get your cost control right from the start, or you’re already on your journey and are running into problems getting a clear view of where you’re spending your money. Moving into Azure, or any other cloud, brings with it a new set of challenges that you just don’t face on-prem, and the big one is that pretty much everything incurs its own running cost.

How DevOps Monitoring Impacts Your Organization

DevOps monitoring didn’t simply become part of the collective engineering consciousness. It was built, brick by brick, by practices that have continued to grow and flourish with each new technological innovation. Have you ever been forced to sit back in your chair, your phone buzzing incessantly, SSH windows and half-written commands dashing across your screen, and admit that you’re completely stumped? Nothing is behaving as it should and your investigations have been utterly fruitless.

GrafanaCONline: What's the bee-weather & how to correct particulate-matter readings

This session covers using variables to combine weather records and forecasts to measure a beehive – and how this can help beekeepers. We’ll also show how to compare particulate-matter (PM) measurements of nearby stations from different networks and develop a humidity-correction for low-cost PM sensors within a Grafana dashboard.

GrafanaCONline: Tanka: Declarative Dashboards for Declarative Clusters

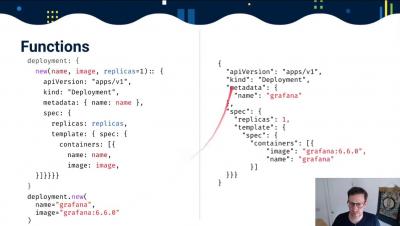
Tanka is a powerful tool for managing Kubernetes resources using the Jsonnet language. Along with a demonstration of deploying Grafana to Kubernetes using Tanka, this session will cover the benefits of deploying your dashboards alongside your code, how to manage Kubernetes resources using Tanka and Jsonnet, and how to create dashboards using Grafonnet and deploy them with Tanka.