Operations | Monitoring | ITSM | DevOps | Cloud
Monitoring
The latest News and Information on Monitoring for Websites, Applications, APIs, Infrastructure, and other technologies.
Getting started with Grafana Loki on Google Kubernetes Engine - under 5 minutes.
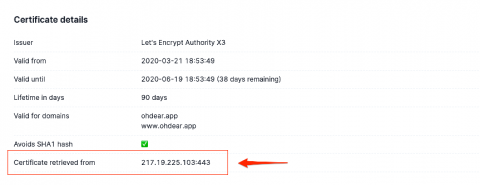
How Oh Dear identified a certificate problem at a large CDN provider
As part of our service, we perform SSL certificate monitoring. We do this slightly different than other providers, which is why were able to detect a problem with the SSL certificates of a large, commercial, CDN provider. In this post, we'll do a technical deep-dive into how we found this problem!
New Features: Alert Management Upgrades
Over the past few months, we’ve been steadily upgrading Instrumental’s alert management features! We’ve improved the overall user interface to make working with alerts faster and easier and added new features.
Alert with Precision and Context using Sentry + PagerDuty
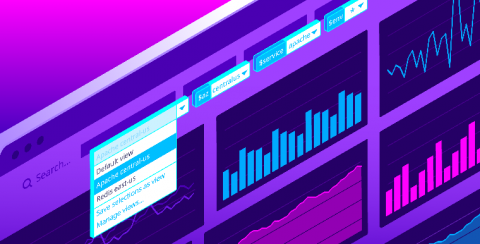
Introducing template variable saved views for dashboards
Datadog dashboards provide immediate visibility and insight into your environments. Setting template variables enables you to filter your dashboard graphs on the fly to visualize specific sets of tagged objects. Now, with saved views, you can save sets of frequently used template variables in order to easily find the data you most care about with just a few clicks.
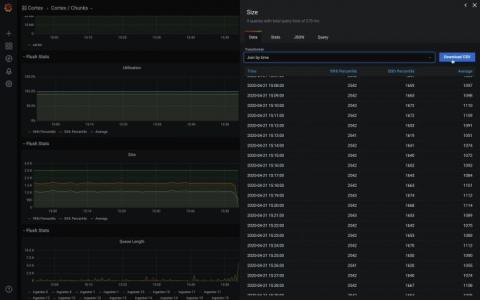
Grafana 7.0 sneak peek: Inspect drawer lets you get raw data and download as CSV
Grafana v7.0 is coming soon! Here’s another sneak peek of one of its features: the inspect drawer. The inspect drawer is a feature that every panel will support, including internal as well as external community plugins. In this new drawer, you will be able to view the raw data in a table format, apply some predefined transformations, and download as CSV. “Download as CSV” previously only existed as a custom feature for the Graph & Table panel.
How to Create Cost-Effective Infrastructure Monitoring
Out of the box monitoring solutions are getting more and more difficult to implement. In addition, they may not have the features you need, and they’re always becoming more expensive. It’s no wonder you’re trying to create a cost-effective solution via infrastructure monitoring cost management on your own by using a combination of your on-site development talent and a few open-source libraries.


