Operations | Monitoring | ITSM | DevOps | Cloud
Monitoring
The latest News and Information on Monitoring for Websites, Applications, APIs, Infrastructure, and other technologies.
Grafana Labs at 5: How We Got Here and Where We're Going
In the beginning, there was a developer using Graphite, and he found its user interface lacking. Then he discovered the Kibana project, liked its UI, and forked it. Grafana was born in 2013. “I started Grafana to do something similar as Kibana, but focused on time series metrics. My goal was to make time series data accessible for a wider audience, to make it easier to build dashboards, to make graphs and dashboards more interactive,” says Torkel Ödegaard.
Magecart Monthly: New Targets - Hospitality, Transport and Retail Industries
Here’s the latest news on Magecart and other website attacks! We’ve trawled the web for the latest news of data breaches, including updates on previous attacks with insights from our own Security Researcher.
What's New in Sentry - August/September Changelog
Ah, August and September — two months that are part of an eleven way tie for first place in our favorite month of the year rankings (sorry, February). We’re currently heads down working on our APM functionality.
Why You NEED to constantly check website speed
No one likes a slow website. Every IT pro needs to constantly check website speed to keep up with the demands of today’s uber-connected world. Fast websites aren’t just about laptops or desktops anymore. Website users connect from a variety of devices like cell phones and smart TVs. This post will discuss website speed testing, including how often you should test your speed, why one speed test probably won’t cut it, and some tips and tricks related to website speed and performance.
Leveraging HashiCorp Consul and Datadog for Service Mesh Deployments
Top 10 Open Source Monitoring Tools for Kubernetes
With over 58K stars on GitHub and over 2,200 contributors across the globe, Kubernetes is the de facto standard for container orchestration. While solving some of the key challenges involved in running distributed microservices, it has also introduced some new ones. Not surprisingly, when asked, engineers list monitoring as one of the main obstacles for adopting Kubernetes. After all, monitoring distributed environments has never been easy and Kubernetes adds additional complexity.
SCOM is the most popular tool for monitoring SBC/ VDI
Google “SCOM and Azure” and the top hits will tell you all about “Moving from SCOM to Azure Monitor”, “Changing of the guard…”, and “Microsoft explains why it replaced SCOM with Azure Monitor” etc. If you only read the marketing, you’d be forgiven for thinking SCOM is being replaced. Microsoft’s marketing push on Azure Monitor has no doubt caused some uncertainty about the position of SCOM.
12 Tools to Provide a Killing Content for Your eCommerce Blog
With so much competition in the world of e-commerce, managing to reach the level of exposure targeted and to maintain your site visitors engaged isn’t easy. You need to use effective strategies that allow you to boost the appeal of your platform, maintain rankings up and decrease bounce rates.
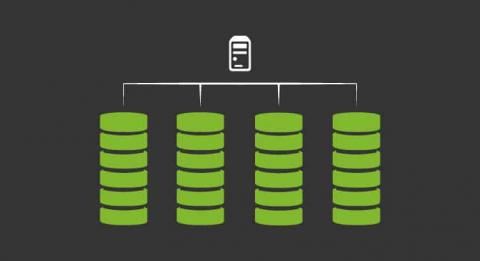
What is RAID? What types of RAID are out there?
What is raid? Do you want to find out? The term RAID is related mostly to those components of our computers that allow us to store information and get our computer up and running properly.. What would we do without hard drives? Well… In this article we are going to learn what a RAID is and some of the types of RAID that exist. Let’s go!


