The latest News and Information on Monitoring for Websites, Applications, APIs, Infrastructure, and other technologies.
As your infrastructure grows more complex, storing long-term metrics becomes difficult and costly to retain. Your team stars to limit the amount of historical data they archive, causing gaps in coverage. Anomalies start to slip through the cracks. Version 1.18 of Netdata aims to solve the monitoring metrics storage problem once and for all. Aside from 5 new collectors, 16 bug fixes, 27 improvements, and 20 documentation updates, here’s what you need to know.
For your team to effectively respond to incidents, you need a shared, unambiguous incident definition so you can recognize when an incident has occurred and assign the appropriate severity. Definitions of an incident differ across teams, but whatever definition you use, identifying and monitoring key service level indicators (SLIs) can help you understand when your service is operating normally—and when its performance has degraded to the point where you need to trigger an incident.
The OpsRamp Fall 2019 Release delivers comprehensive features for hybrid infrastructure management with machine learning-powered intelligent correlation and multi-cloud monitoring support. The new release also offers enhanced synthetic monitoring capabilities and a new custom integration framework for sharing data with third-party IT management tools.
Ask two developers whether SOAP (Simple Object Access Protocol) or REST (Representational State Transfer) is better for accessing web services and you’ll likely get two different answers – and maybe more. It’s a passionate debate, but the reality is that the best solution depends on the application. Let’s take a look at these two options and discuss the main pros and cons.
These days, it is quite hard to find a person who does not use the Internet. Even older people have already got a web connection for communication and mastering the most popular apps. This makes the Net such a useful tool. However, certain dangers lay under this cross-functionality that can be avoided using Virtual Private Networks or VPNs for short.
Establishing a performance budget early in the development cycle for websites and APIs is the optimum choice for keeping your websites and web services fast for all users. However, it is never too late to set a web performance budget to improve your user experience. Keeping your users in mind, a web performance budget allows you to make decisions based on your preferred page speed.
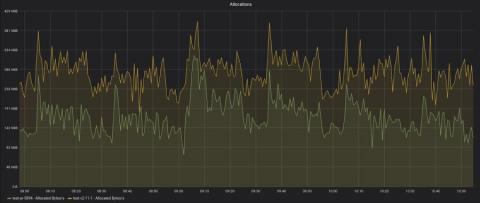
Grafana Labs has 8+ clusters in GKE running 270 nodes of various sizes, and all the hosted metrics and hosted log Grafana Cloud offerings are run on 16-core, 64-gig machines. At the recent All Systems Go! conference in Berlin, David Kaltschmidt, Director, User Experience, gave a talk about what monitoring these clusters and servers looks like at Grafana Labs and shared some best practices.
The team at Chrome has announced their plans for handling mixed content last week on their blog. We'll highlight the most important details and what the potential impact is.