Operations | Monitoring | ITSM | DevOps | Cloud

Monitoring

The latest News and Information on Monitoring for Websites, Applications, APIs, Infrastructure, and other technologies.

How Many Metrics? A Guide to Estimating the Size of Your System

Our hosted metrics offering, Grafana Cloud, is billed based on usage; a common question we get is “How much will it cost to monitor N servers?” We charge $49/month for every 3,000 active series or 18,000 data points per minute (dpm), whichever is higher. To help you understand what that translates to in terms of how much storage you need, here’s a rough guide to estimating the size of your system.

On Premises to Cloud: Easing the Transition

A recent Gartner report states: “Organizations with a cross-discipline cloud strategy are more likely to find success in cloud initiatives and recognize the full benefits of cloud.” Advances in machine learning and AI have opened up avenues for forward-thinking enterprises to drive extensive automation using the latest cloud technologies.

Monitoring and incident management: a winning combination

Monitoring systems gather and log a wide range of performance data on a diverse range of targets—from applications to user experience, networks, servers, and more. Usually, monitoring is conducted under runtime conditions, but synthetic monitoring can also be used to simulate loads and test the resilience of web services, for example.

Sentry for Native Crashes: Gaming, IoT, and Beyond

Application crashes have a significant impact on customer experience, which can adversely affect a company’s reputation and revenue. Error and crash reporting is a unique feedback mechanism that provides true data about the quality of their product. Developer teams that create games, mobile applications, IoT, and other high-performance applications need rich insights into application health to quickly and continuously fix software errors with minimal impact.

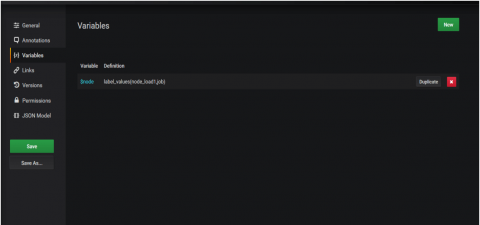
How to Fix a Broken Grafana Dashboard with the API

Recently, we ran into a problem where a customer’s dashboard broke to such an extent that it hung on loading. This is a really rare problem and in this case was an instance where the customer had created a variable that referenced itself. Once the dashboard is broken in this way, it is impossible to reach a screen allowing you to remove that variable. This post is not about how it was broken, but about how we resolved the error.

What Is The True Impact of an IT Outage?

We live in a digital world, and it’s becoming more and more apparent every day. We rely on our smartphones to give us directions to where we need to go. We rely on email to share information with our colleagues, family and friends. We access our medical records through online portals. We even hail a rideshare through an app that connects us to drivers in locations across the globe.

Sentry and Rookout Integration: A Better way to Find and Debug Errors in Your Code

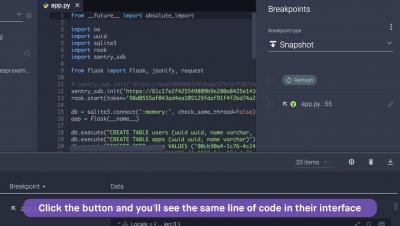
Rookout’s new Sentry integration empowers you to fix bugs faster than ever before. Sentry features allow you to identify the exact location of an error in your code. With the Rookout integration, you will find an additional prompt to debug the issue live, in production, in Rookout. With the click of a button you will see the same line of code from Sentry highlighted in Rookout’s IDE-like interface, without restarting, redeploying or adding more code. In Rookout you can set non breaking breakpoints and trigger the error again to receive the real time debug data.