Operations | Monitoring | ITSM | DevOps | Cloud

Monitoring

The latest News and Information on Monitoring for Websites, Applications, APIs, Infrastructure, and other technologies.

Top 8 Active Directory Performance Problems and How to Solve Them

Microsoft Active Directory is a key component of the IT infrastructure of any organization that uses Microsoft Windows servers or desktops. Active Directory is responsible for managing users, their accounts and their access to individual computers, shared drivers, printers, servers and more. From a user’s perspective, Active Directory’s single sign-on capability ensures that users do not have to remember and use different passwords for different types of accesses.

A SAR app to propagate CloudFormation tags to unsupported resources

Did you know that CloudFormation tags don’t automatically propagate to some resource types? Chief among these are CloudWatch log groups, which means you can’t include them in your cost monitoring (via cost allocation tags) among other things. The only way to tag CloudWatch log groups right now is via API calls. You can do this with the AWS SDK, or using the AWS CLI. This is hugely inconvenient!

6 Awesome TED Talks Every MSP Needs to See

As the managed services market becomes increasingly competitive, you’re likely looking for ways to boost your MSP’s productivity and efficiency. You’ve already got a stellar PSA, RMM, and network management tool, but you need something more. You need something like a TED Talk… or six… to inspire fresh ideas and make your MSP the best it can be. That’s why we surfed the web and found six seriously awesome speakers to bring you a new perspective on your business.

How to Reduce Bounce Rate

In the field of website optimisation a term which often crops up more than any other is that of ‘bounce rate’. When discussions about your website take place, you may have heard in passing that ‘your bounce rate is too high’, or that ‘we need to reduce the bounce rate to increase rankings’. But what do you do if your bounce rate is too high, and how would you go about reducing a high bounce rate?

Monitor a Laravel app with Scout

Last month we talked about the PHP monitoring landscape in 2019 and announced that Scout APM would soon be available for monitoring your Laravel applications too (as well as your Ruby, Python and Elixir apps of course!). Now that our PHP monitoring agent is ready for beta testing, we thought it would be a good idea to show you folks how easy it is to get started with it and to highlight the main features to the Laravel community.

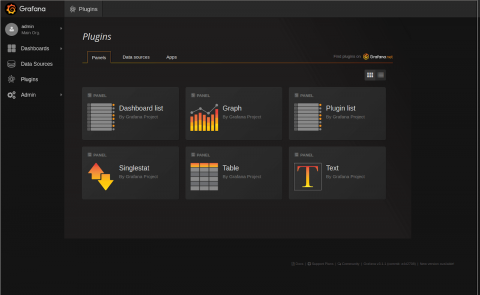
The (Mostly) Complete History of Grafana UX

Before Grafana, there was Kibana 3. Kibana was revolutionary when it came out, because it allowed you to use Elasticsearch in a very new way, for log analytics and not just normal document search, and to build dashboards without writing JSON documents. It had this nice UI, which let you drag panels around. But editing panels was a little tricky; you could only edit them in this sort of fullscreen modal. Still, it was really good for its time.

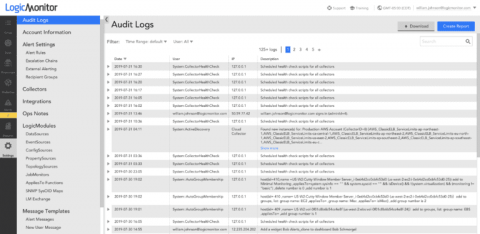
The Power of Audit Logs

If you’re a LogicMonitor customer, the platform’s Audit Logs may seem like a rudimentary means to track user actions, but they can actually be a powerful tool for troubleshooting and getting historical data within your portal. For instance, let’s say you notice that the alerting for a particular device group has been unexpectedly disabled.

Honeybadger Integration with Scout

We are happy to announce that Scout now integrates with the popular error monitoring solution, Honeybadger. This integration brings a similar feature set to our existing Rollbar, Sentry and Bugsnag integrations, and it allows you to see your errors and exceptions alongside your performance metrics all on a single page. So let’s take this opportunity to take a closer look at Honeybadger and see how you can get it setup within Scout in just a few minutes!